How to Install Prometheus on Ubuntu 22.04


Do you experience unreliable software and infrastructure performance? Do you seek a solution to improve the efficiency of your system? A monitoring tool might be what you seek!
One such tool for monitoring system performance is Prometheus. It is an open-source software that can be used for alerting and monitoring. This article will guide you through a step-by-step process of installing and configuring Prometheus on Ubuntu 22.04. Using Ubuntu 24.04? Check our guide on how to install Prometheus on Ubuntu 24.04.
#What is Prometheus?
Prometheus monitoring solution is a free and open-source solution for monitoring metrics, events, and alerts. It collects and records metrics from servers, containers, and applications. In addition to providing a flexible query language (PromQL), and powerful visualization tools, it also provides an alerting mechanism that sends notifications when needed.
#System Requirements/Prerequisites
This tutorial will be hands-on. If you'd like to follow along, be sure you have the following:
- Basic knowledge of the Linux command-line interface (CLI);
- Ubuntu 22.04 server;
- A user account with sudo privileges.
#How to install Prometheus on Ubuntu 22.04
In this section, you'll go through the steps on how to install Prometheus on Ubuntu 22.04.
#Step 1 - Update System Packages
You should first update your system's package list to ensure that you are using the most recent packages. To accomplish this, issue the following command:
sudo apt update
#Step 2 - Create a System User for Prometheus
Now create a group and a system user for Prometheus. To create a group and then add a user to the group, run the following command:
sudo groupadd --system prometheus
sudo useradd -s /sbin/nologin --system -g prometheus prometheus

This will create a system user and group named "prometheus" for Prometheus with limited privileges, reducing the risk of unauthorized access.
#Step 3 - Create Directories for Prometheus
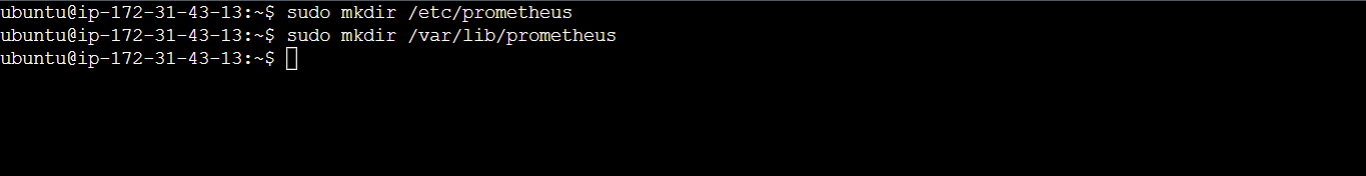
To store configuration files and libraries for Prometheus, you need to create a few directories. The directories will be located in the /etc and the /var/lib directory respectively. Use the commands below to create the directories:
sudo mkdir /etc/prometheus
sudo mkdir /var/lib/prometheus
#Step 4 - Download Prometheus and Extract Files
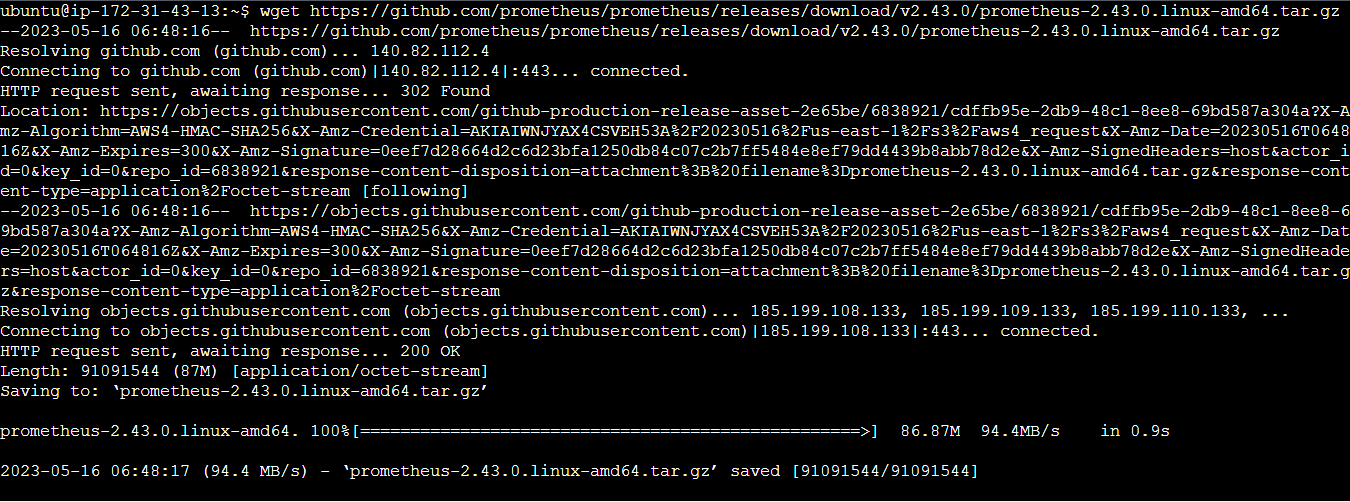
To download the latest update, go to the Prometheus official downloads site and copy the download link for Linux Operating System. Download using wget and the link you copied like so:
wget https://github.com/prometheus/prometheus/releases/download/v2.43.0/prometheus-2.43.0.linux-amd64.tar.gz
You should see it being downloaded.
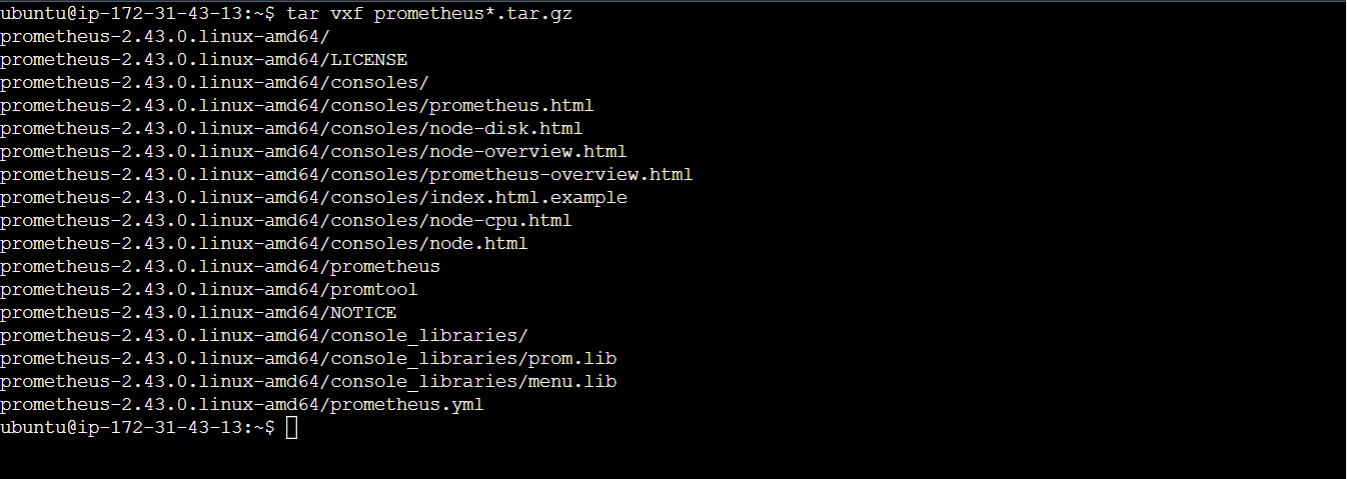
After the download has been completed, run the following command to extract the contents of the downloaded file:
tar vxf prometheus*.tar.gz
#Step 5- Navigate to the Prometheus Directory
After extracting the files, navigate to the newly extracted Prometheus directory using the following command:
cd prometheus*/
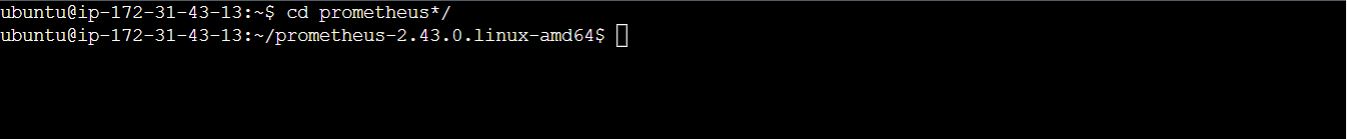
Changing to the Prometheus directory allows for easier management and configuration of the installation. Subsequent steps will be performed within the context of the Prometheus directory.
#Configuring Prometheus on Ubuntu 22.04
With Prometheus downloaded and extracted on Ubuntu 22.04, you can go on to configure it. Configuring Prometheus could involve specifying the metrics to be collected, defining targets to scrape metrics from, and configuring alerting rules and recording rules. You will learn how to set up Prometheus on Ubuntu 22.04 in this section. You would just be concentrating on the default setup that enables you to access Prometheus through your web browser.
#Step 1 - Move the Binary Files & Set Owner
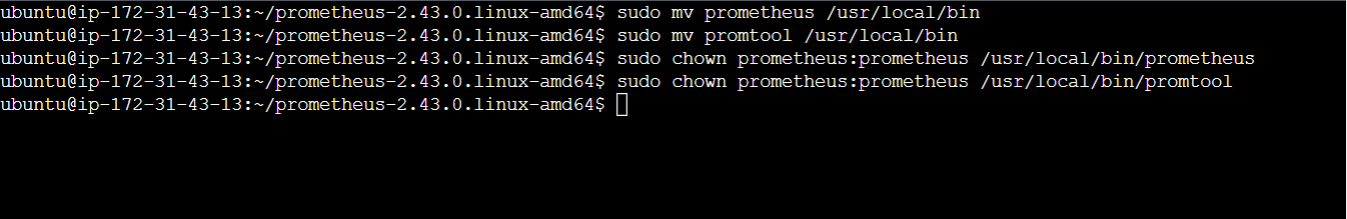
First, you need to move some binary files (prometheus and promtool) and change the ownership of the files to the "prometheus" user and group. You can do this with the following commands:
sudo mv prometheus /usr/local/bin
sudo mv promtool /usr/local/bin
sudo chown prometheus:prometheus /usr/local/bin/prometheus
sudo chown prometheus:prometheus /usr/local/bin/promtool
#Step 2 - Move the Configuration Files & Set Owner
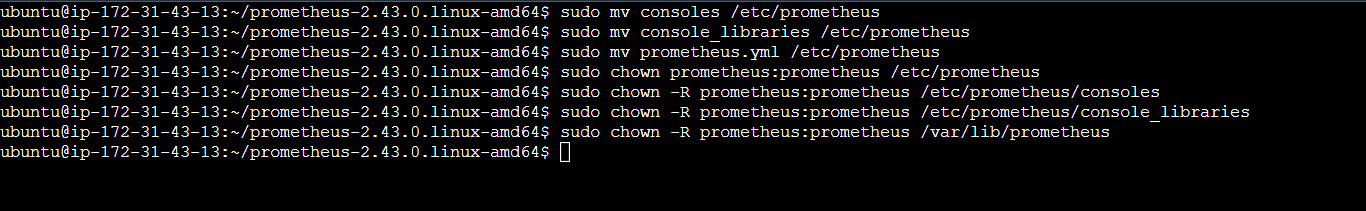
Next, move the configuration files and set their ownership so that Prometheus can access them. To do this, run the following commands:
sudo mv consoles /etc/prometheus
sudo mv console_libraries /etc/prometheus
sudo mv prometheus.yml /etc/prometheus
sudo chown prometheus:prometheus /etc/prometheus
sudo chown -R prometheus:prometheus /etc/prometheus/consoles
sudo chown -R prometheus:prometheus /etc/prometheus/console_libraries
sudo chown -R prometheus:prometheus /var/lib/prometheus
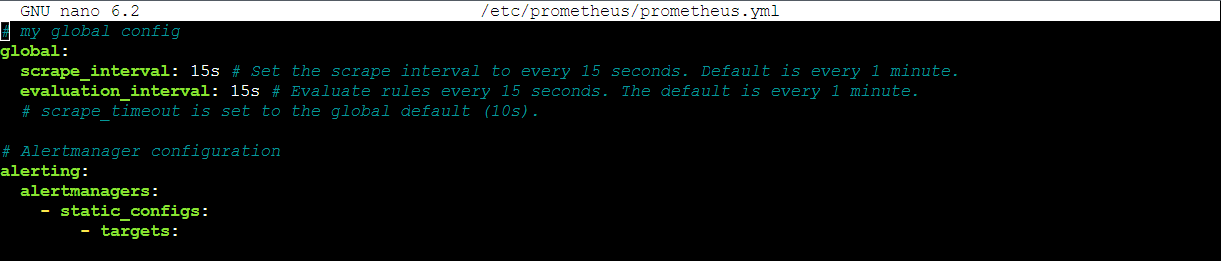
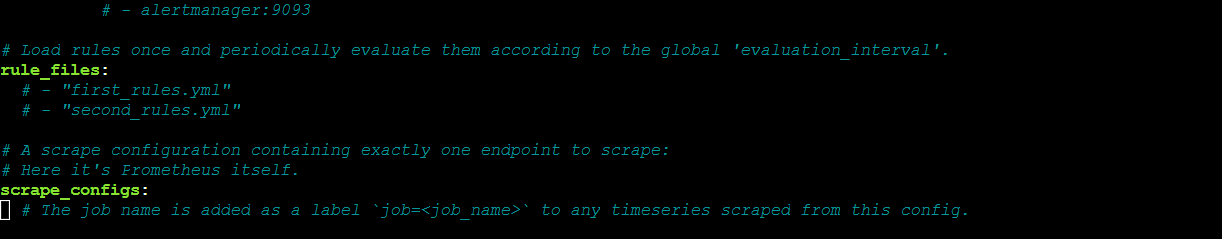
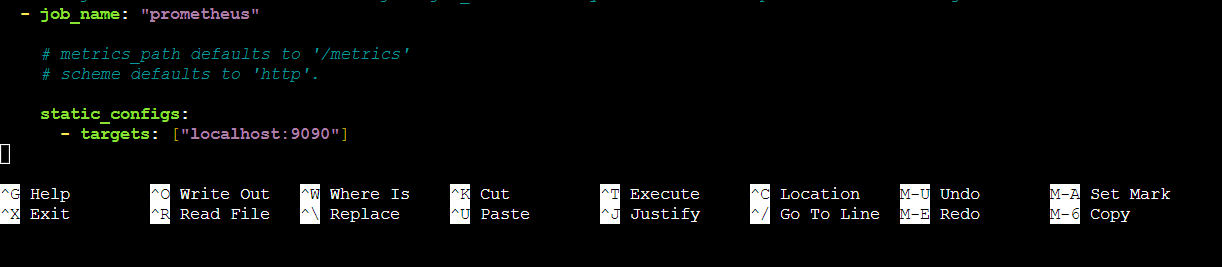
The prometheus.yml file is the main Prometheus configuration file. It includes settings for targets to be monitored, data scraping frequency, data processing, and storage. You can set alerting rules and notification conditions in the file. You don't need to modify this file for this demonstration but feel free to open it in an editor to take a closer look at its contents.
sudo nano /etc/prometheus/prometheus.yml
Here's the default content of the Prometheus file:
#Step 3 - Create Prometheus Systemd Service
Now, you need to create a system service file for Prometheus. Create and open a prometheus.service file with the Nano text editor using:
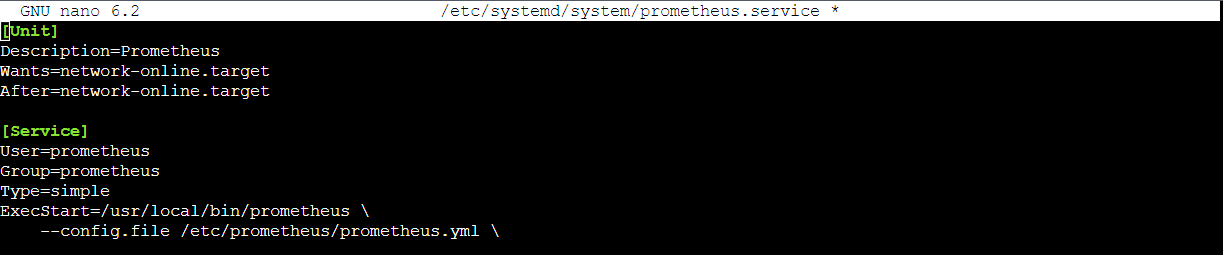
sudo nano /etc/systemd/system/prometheus.service
Include these settings to the file, save, and exit:
[Unit]
Description=Prometheus
Wants=network-online.target
After=network-online.target

[Service]
User=prometheus
Group=prometheus
Type=simple
ExecStart=/usr/local/bin/prometheus \
    --config.file /etc/prometheus/prometheus.yml \
    --storage.tsdb.path /var/lib/prometheus/ \
    --web.console.templates=/etc/prometheus/consoles \
    --web.console.libraries=/etc/prometheus/console_libraries

[Install]
WantedBy=multi-user.target
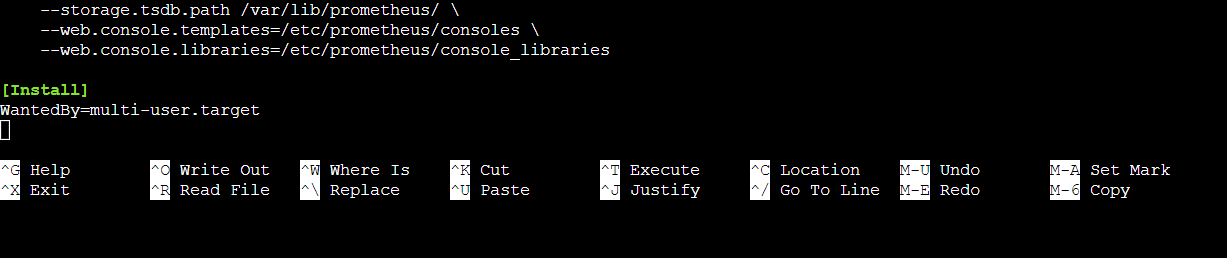
The "systems" service file for Prometheus defines how Prometheus should be managed as a system service on Ubuntu. It includes the service configuration, such as the user and group it should run as. It also includes the path to the Prometheus binary and the Prometheus configuration file location. Additionally, the file can be used to set storage locations for metrics data and pass additional command-line options to the Prometheus binary when it starts.
#Step 4 - Reload Systemd
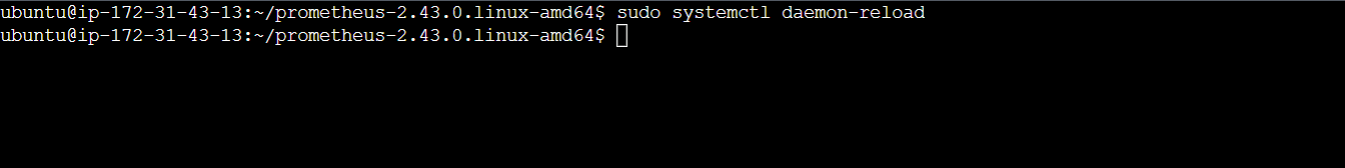
You need to reload the system configuration files after saving the prometheus.service file so that changes made are recognized by the system. Reload the system configuration files using the following:
sudo systemctl daemon-reload
#Step 5 - Start Prometheus Service
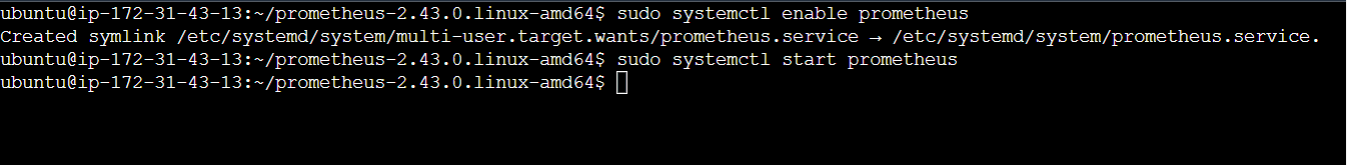
Next, you want to enable and start your Prometheus service. Do this using the following commands:
sudo systemctl enable prometheus
sudo systemctl start prometheus
#Step 5 - Check Prometheus Status
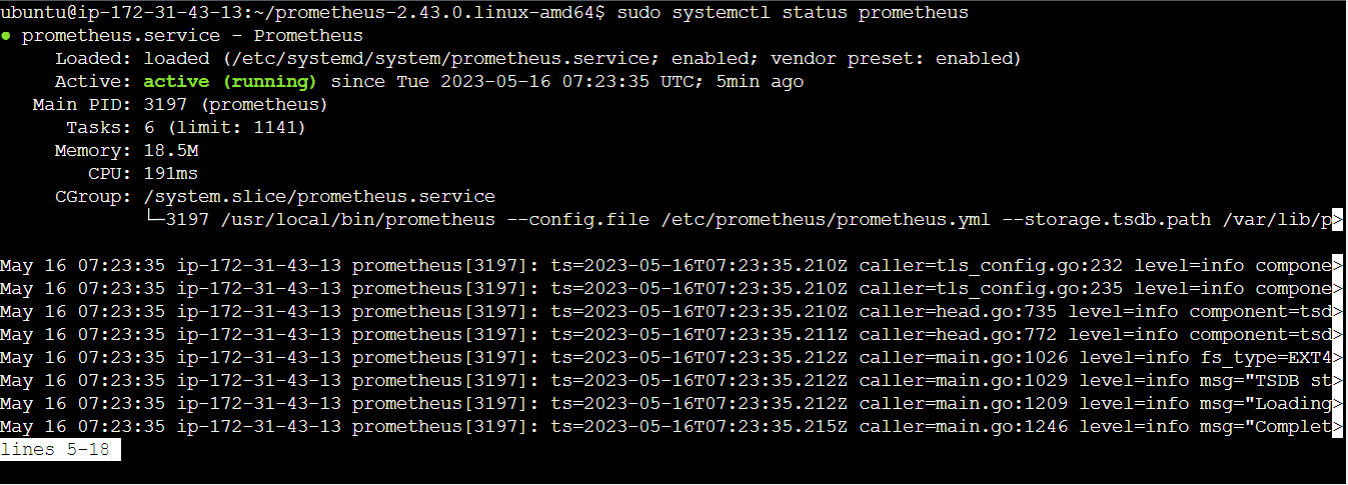
After starting the Prometheus service, you may confirm that it is running or if you have encountered errors using:
sudo systemctl status prometheus
Sample output:
#Access Prometheus Web Interface
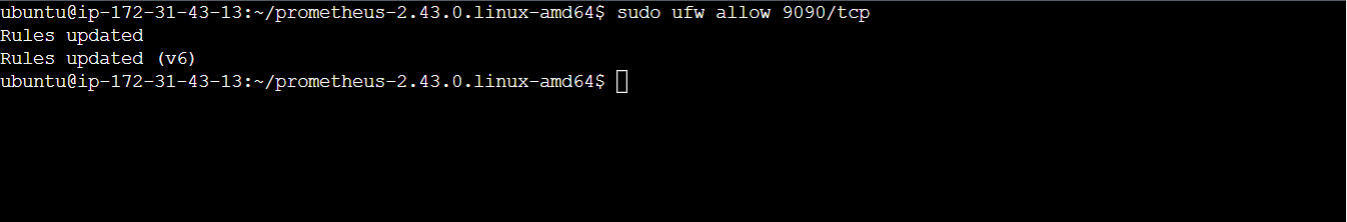
Prometheus runs on port 9090 by default so you need to allow port 9090 on your firewall, Do that using the command:
sudo ufw allow 9090/tcp
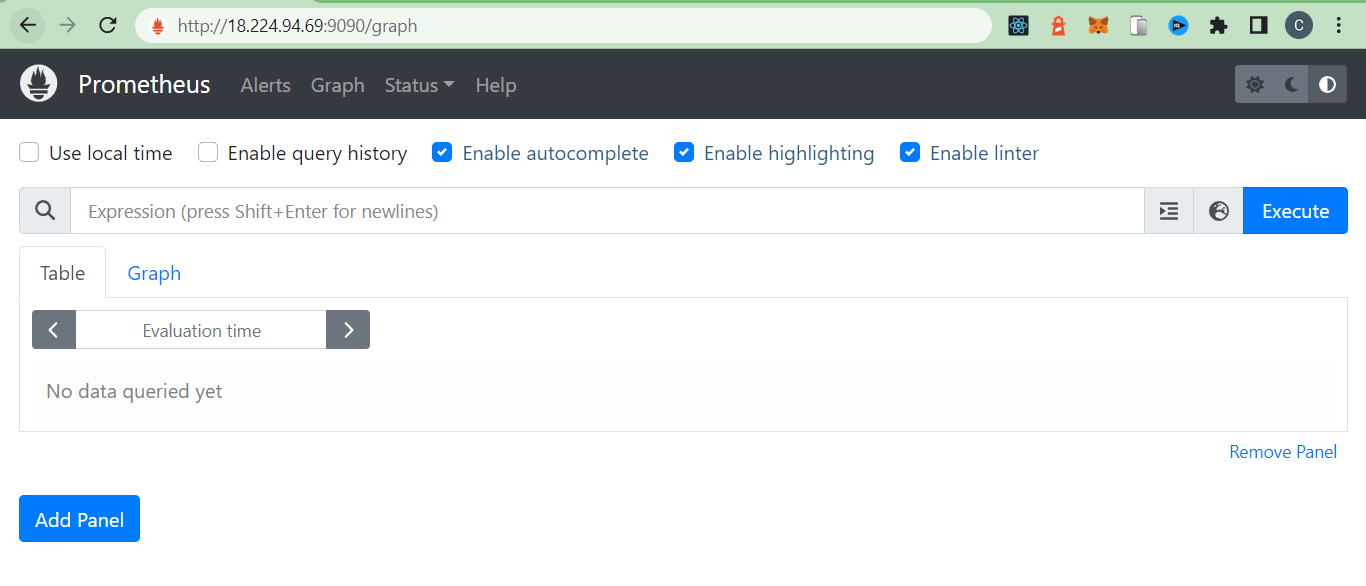
With Prometheus running successfully, you can access it via your web browser using http://localhost:9090 or <ip_address>:9090
Also read: Server Monitoring with Prometheus and Grafana
#Conclusion
Prometheus is an excellent monitoring solution. In this article, you've learned how to install and configure Prometheus on Ubuntu 22.04 but you can achieve more with this tool. Prometheus lets you set up alerting, add exporters, or create custom dashboards. Why not try one or more of these?