How to Set Up Grafana with Prometheus? Step-by-Step Guide


It can be challenging to always see increasing demands for stability, uptime, or efficient performance when managing a growing application. You need a reliable way to understand what’s happening across your servers at any given moment.
This is where a robust monitoring stack comes in—and Grafana and Prometheus together, are one of the most powerful combinations available. With Prometheus collecting data and Grafana helping you make sense of it with clear, customizable dashboards, you’ll have the tools to monitor your applications and respond to issues before they get to your users.
This tutorial provides a hands-on guide to setting up Prometheus and Grafana, from installation to creating customized dashboards.
#Prerequisites
To follow this guide effectively, ensure you have:
- The Latest Ubuntu Server installed. This tutorial uses Ubuntu 24.04 LTS.
- Basic knowledge of Linux commands.
- A user account with sudo privileges.
With these, you can proceed to install Prometheus.
#Install Prometheus
In this section, you’ll learn how to install Prometheus on Ubuntu 24.04. However, before you begin the installation, it’s important you understand what Prometheus is and how it works.
#What is Prometheus?
Prometheus is an open-source tool that helps you monitor your systems and applications by collecting data about how they’re running. It regularly collects information like CPU usage, memory, and network activity from various sources you set up, then stores that data in a way that lets you look analyze and quickly identify potential issues.
One of Prometheus's features is its alerting system, which can notify you if any anomalies are detected, such as CPU utilization or insufficient memory levels. Prometheus uses a language called PromQL to search through the collected data.
Now that you have a basic understanding of Prometheus and its role follow these steps to proceed with the installation:
#Step 1: Check your system architecture
To ensure compatibility, begin by checking your system’s architecture. This will help you know which version of Prometheus to download.
Run the following command to identify your architecture:
uname -m
You should see any of these outputs:
x86_64for 64-bit Intel/AMD systemsaarch64for ARM 64-bit systems (e.g., Apple Silicon Macs running Linux VMs)
#Step 2: Update system packages
Update your package list to ensure you’re working with the latest versions:
sudo apt update
#Step 3: Create a Prometheus user and group
For security, create a dedicated Prometheus user and group. This will allow Prometheus to run with limited privileges, which is a best practice for system security:
sudo groupadd --system prometheus
sudo useradd -s /sbin/nologin --system -g prometheus prometheus
#Step 4: Set up directories for Prometheus
Create directories for Prometheus’s configuration and data storage to keep everything organized:
sudo mkdir /etc/prometheus
sudo mkdir /var/lib/prometheus
#Step 5: Download and extract Prometheus
Now, download the correct Prometheus version based on your system’s architecture.
Firstly, go to the Prometheus download page and find the latest stable release. This tutorial uses version 2.55.0.
For 64-bit Intel/AMD systems (x86_64):
wget https://github.com/prometheus/prometheus/releases/download/v2.55.0/prometheus-2.55.0.linux-amd64.tar.gz
For ARM 64-bit systems (aarch64):
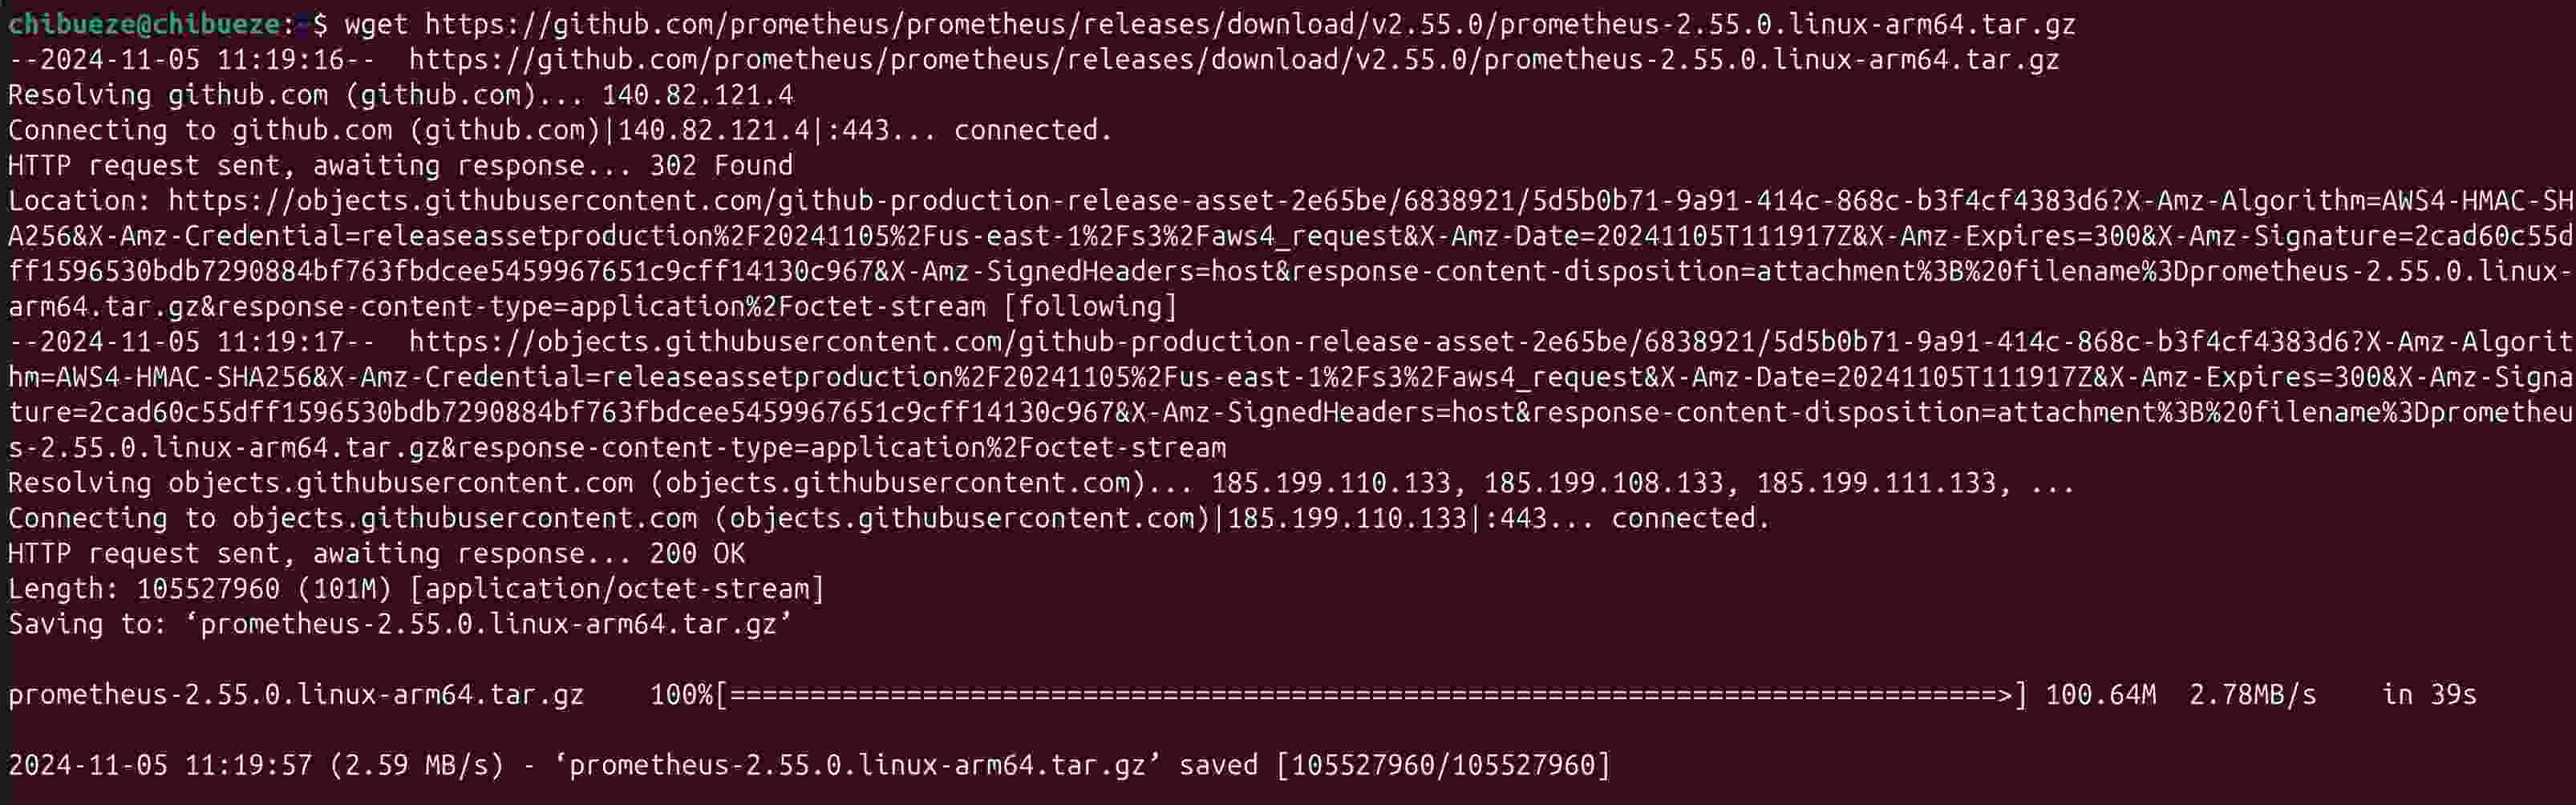
wget https://github.com/prometheus/prometheus/releases/download/v2.55.0/prometheus-2.55.0.linux-arm64.tar.gz
You should see a similar output after the download:
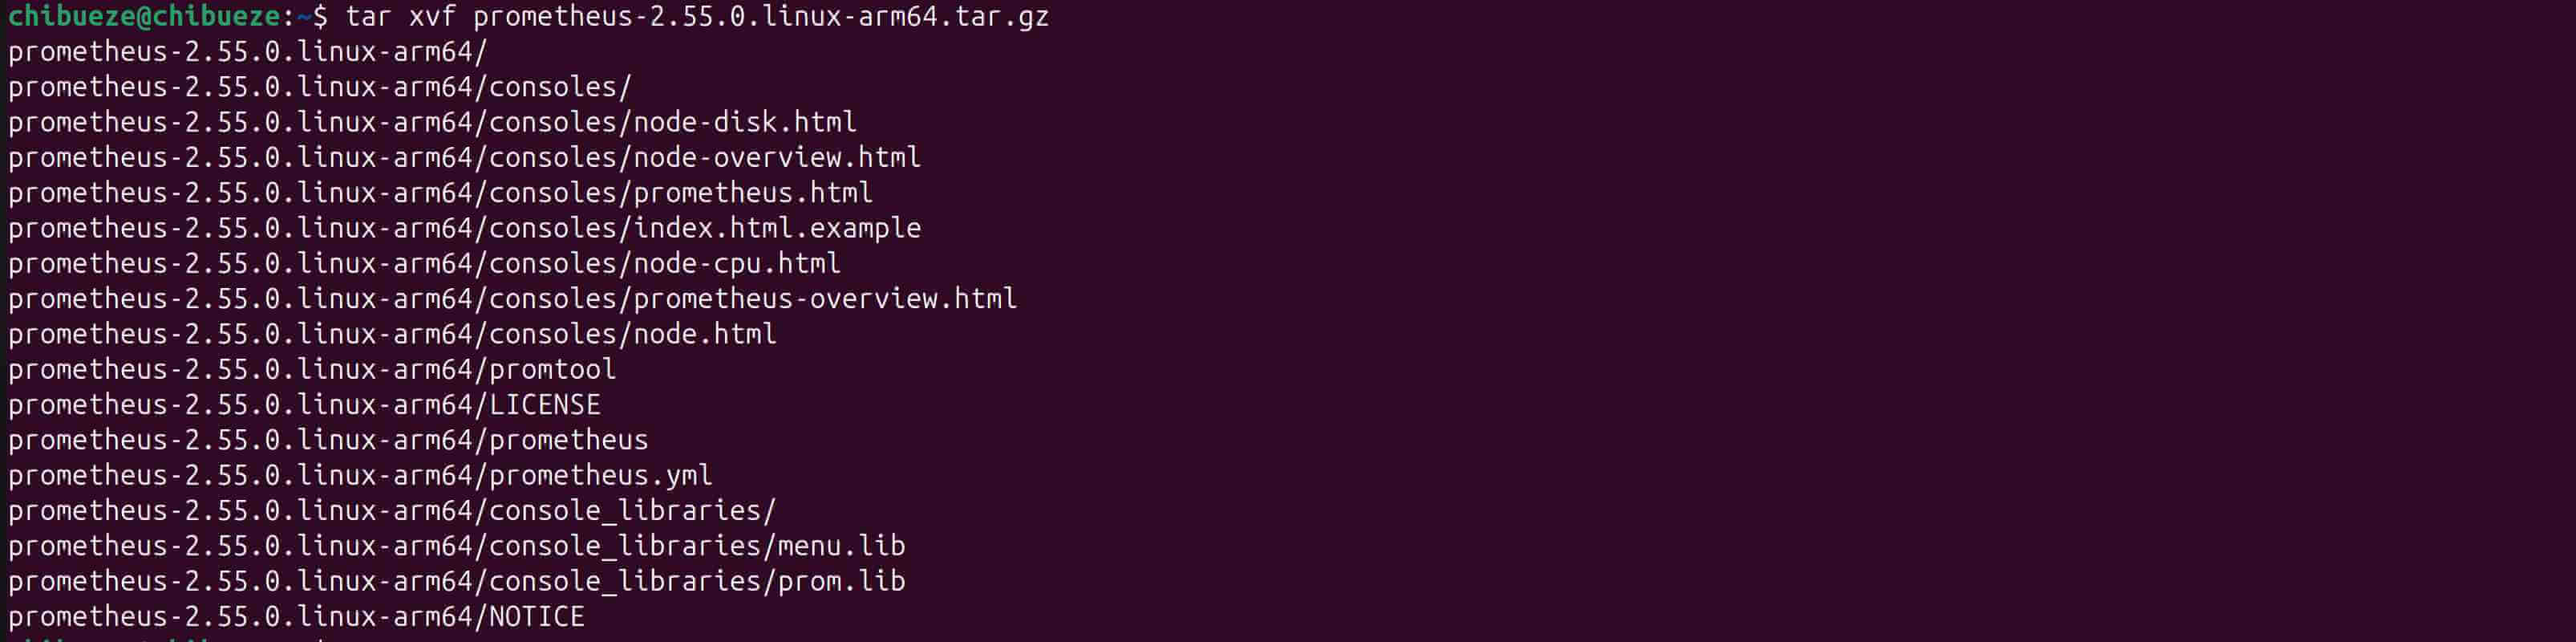
Now, extract Prometheus using the following command:
tar xvf prometheus-2.55.0.linux-<architecture>.tar.gz
Replace <architecture> with either amd64 or arm64, depending on your system.
#Configure Prometheus
With Prometheus installed, it’s time to configure it to ensure smooth operation and prepare it for data collection. In this section, you’ll move the main files to appropriate locations, set the right permissions, and configure Prometheus to run as a background service.
#Step 1: Move binaries and set permissions
Move the Prometheus binaries, prometheus and promtool, to /usr/local/bin/. This makes them easily accessible from anywhere on your system.
For 64-bit Intel/AMD systems (x86_64):
sudo mv prometheus-2.55.0.linux-amd64/prometheus /usr/local/bin/
sudo mv prometheus-2.55.0.linux-amd64/promtool /usr/local/bin/
For ARM 64-bit systems (aarch64):
sudo mv prometheus-2.55.0.linux-arm64/prometheus /usr/local/bin/
sudo mv prometheus-2.55.0.linux-arm64/promtool /usr/local/bin/
After moving the binaries, modify their ownership so that the prometheus user has the necessary permissions to manage them:
sudo chown prometheus:prometheus /usr/local/bin/prometheus
sudo chown prometheus:prometheus /usr/local/bin/promtool
#Step 2: Move configuration files and set ownership
Prometheus needs its configuration files to run properly. Move these to /etc/prometheus and set ownership to the prometheus user.
For 64-bit Intel/AMD systems (x86_64):
sudo mv prometheus-2.55.0.linux-amd64/consoles /etc/prometheus
sudo mv prometheus-2.55.0.linux-amd64/console_libraries /etc/prometheus
sudo mv prometheus-2.55.0.linux-amd64/prometheus.yml /etc/prometheus
For ARM 64-bit systems (aarch64):
sudo mv prometheus-2.55.0.linux-arm64/consoles /etc/prometheus
sudo mv prometheus-2.55.0.linux-arm64/console_libraries /etc/prometheus
sudo mv prometheus-2.55.0.linux-arm64/prometheus.yml /etc/prometheus
After moving the files, set ownership so the prometheus user has access to these directories:
sudo chown -R prometheus:prometheus /etc/prometheus
sudo chown -R prometheus:prometheus /var/lib/prometheus
#Step 3: Create a systemd service file for Prometheus
To have Prometheus run as a background service and start automatically on boot, set it up as a systemd service. This allows you to manage Prometheus with standard systemd commands such as start, stop, and restart:
sudo tee /etc/systemd/system/prometheus.service > /dev/null <<EOF
[Unit]
Description=Prometheus Monitoring
Wants=network-online.target
After=network-online.target

[Service]
User=prometheus
Group=prometheus
Type=simple
ExecStart=/usr/local/bin/prometheus \\
  --config.file=/etc/prometheus/prometheus.yml \\
  --storage.tsdb.path=/var/lib/prometheus/ \\
  --web.console.templates=/etc/prometheus/consoles \\
  --web.console.libraries=/etc/prometheus/console_libraries

[Install]
WantedBy=multi-user.target
EOF
#Step 4: Reload systemd and start Prometheus
Now that you’ve created the service file, you’ll need to take a few steps to activate Prometheus as a managed systemd service.
Run the following command to reload systemd:
sudo systemctl daemon-reload
Enable Prometheus to start on boot:
sudo systemctl enable prometheus
Finally, start Prometheus with the following command:
sudo systemctl start prometheus
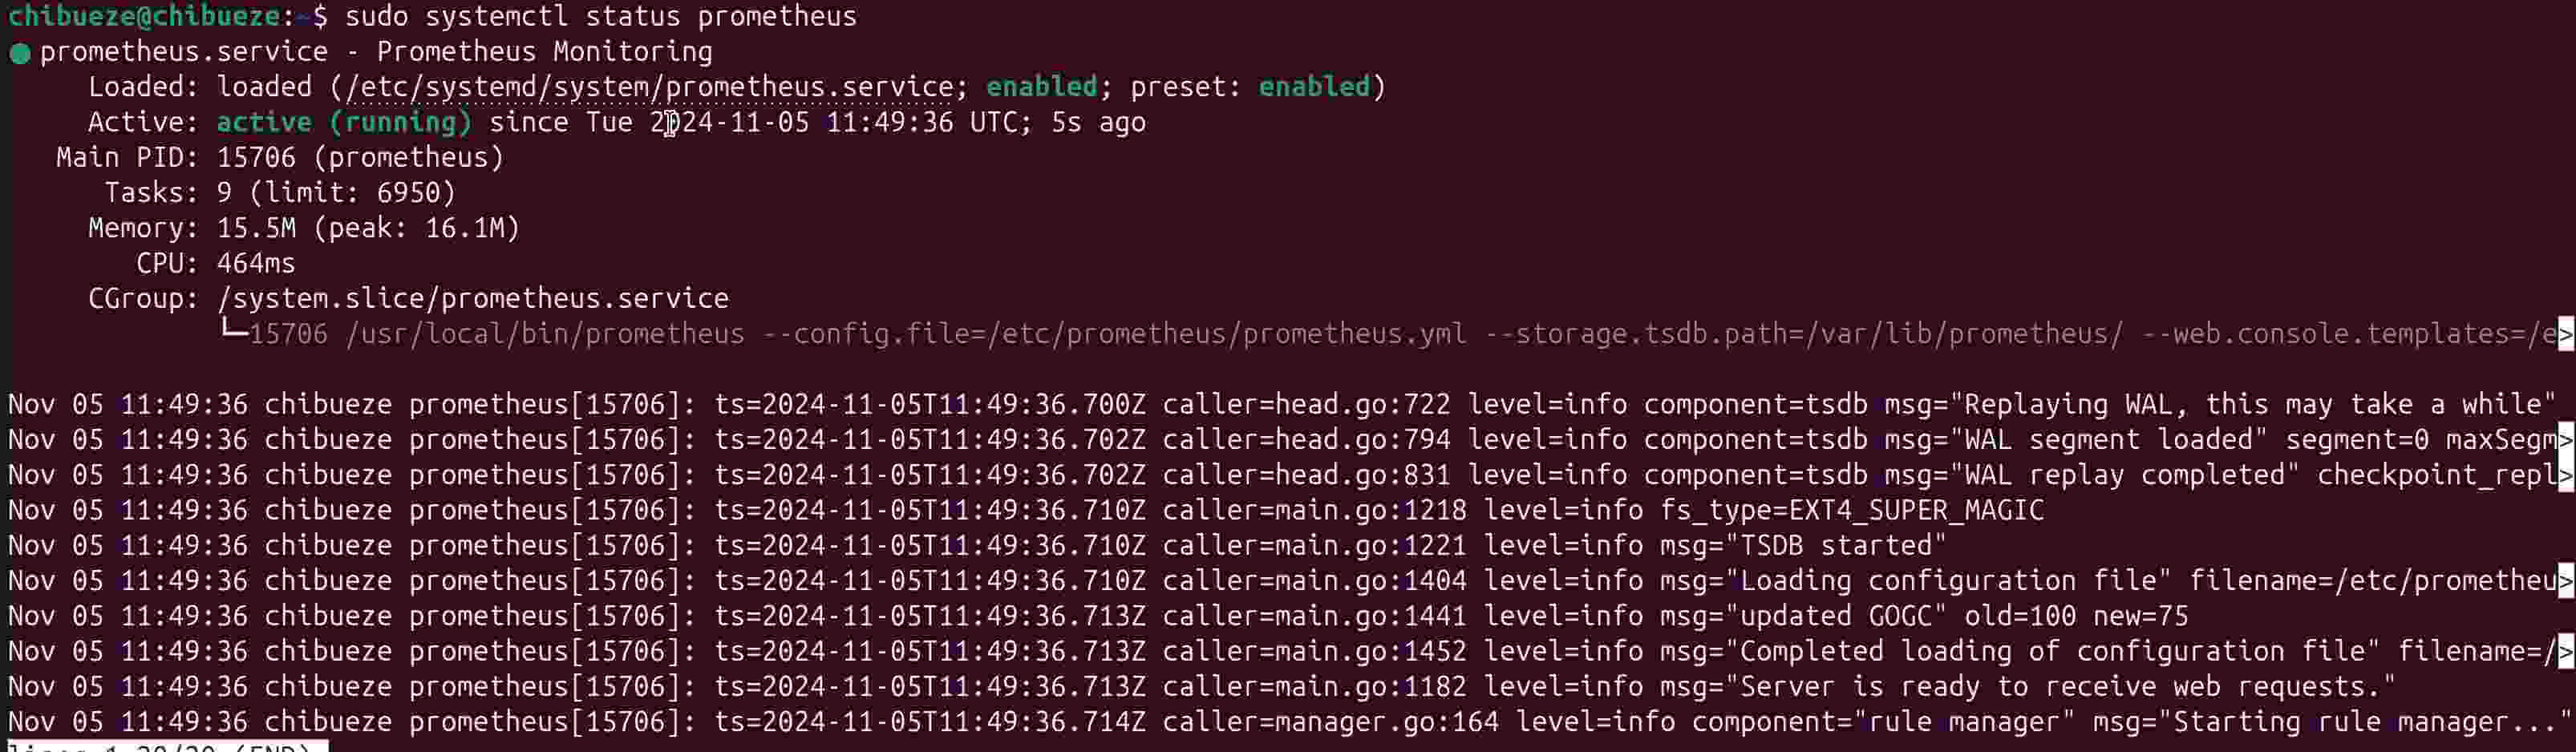
Prometheus should be active and running in the background and ready to start collecting data. Confirm that everything is working correctly by running this command:
sudo systemctl status prometheus
The above command should display a similar output to the following:
#Access Prometheus from a web browser
With Prometheus running, visit http://localhost:9090 to view its web interface. You’ll find tabs like Graph for running queries and Status for checking the overall health of your setup.
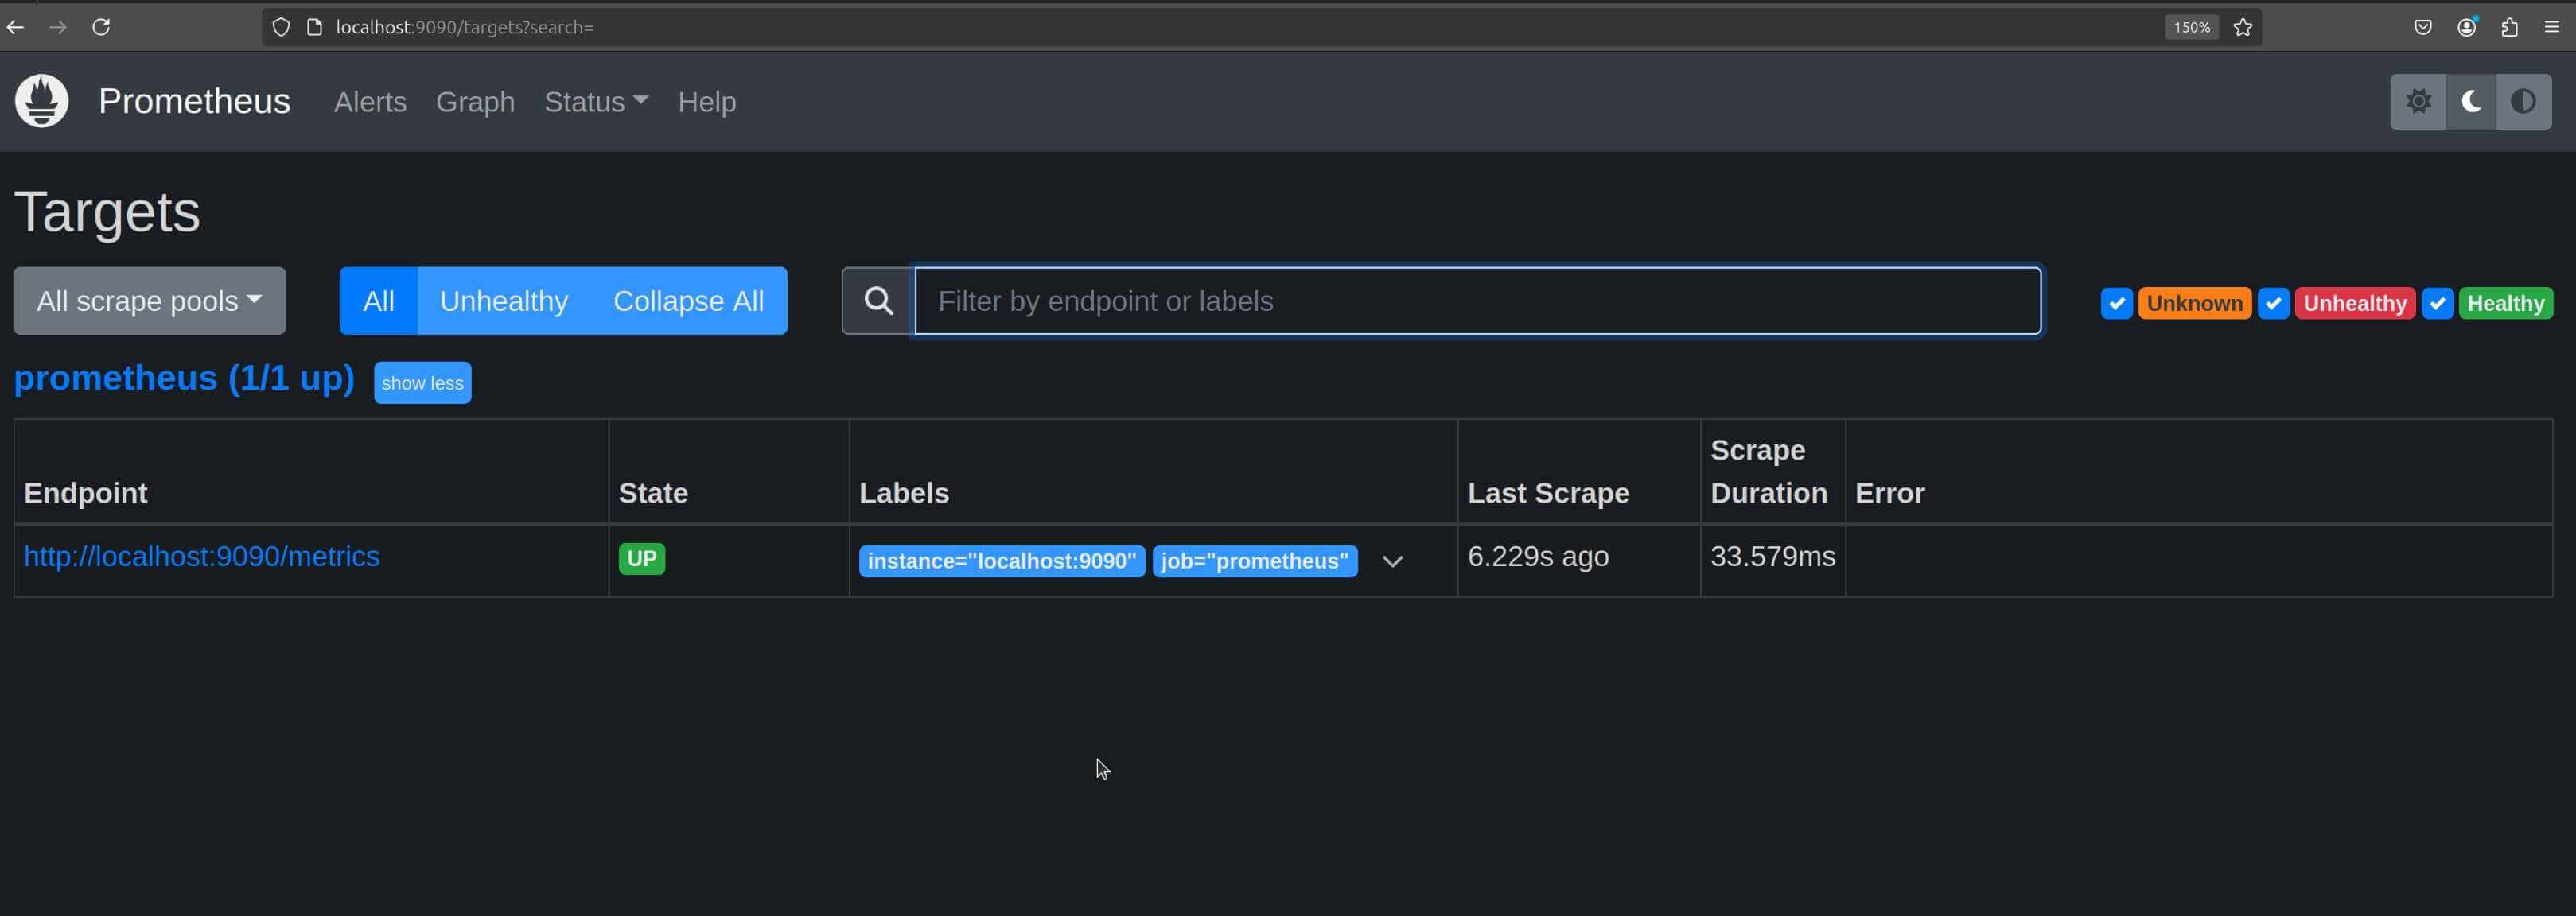
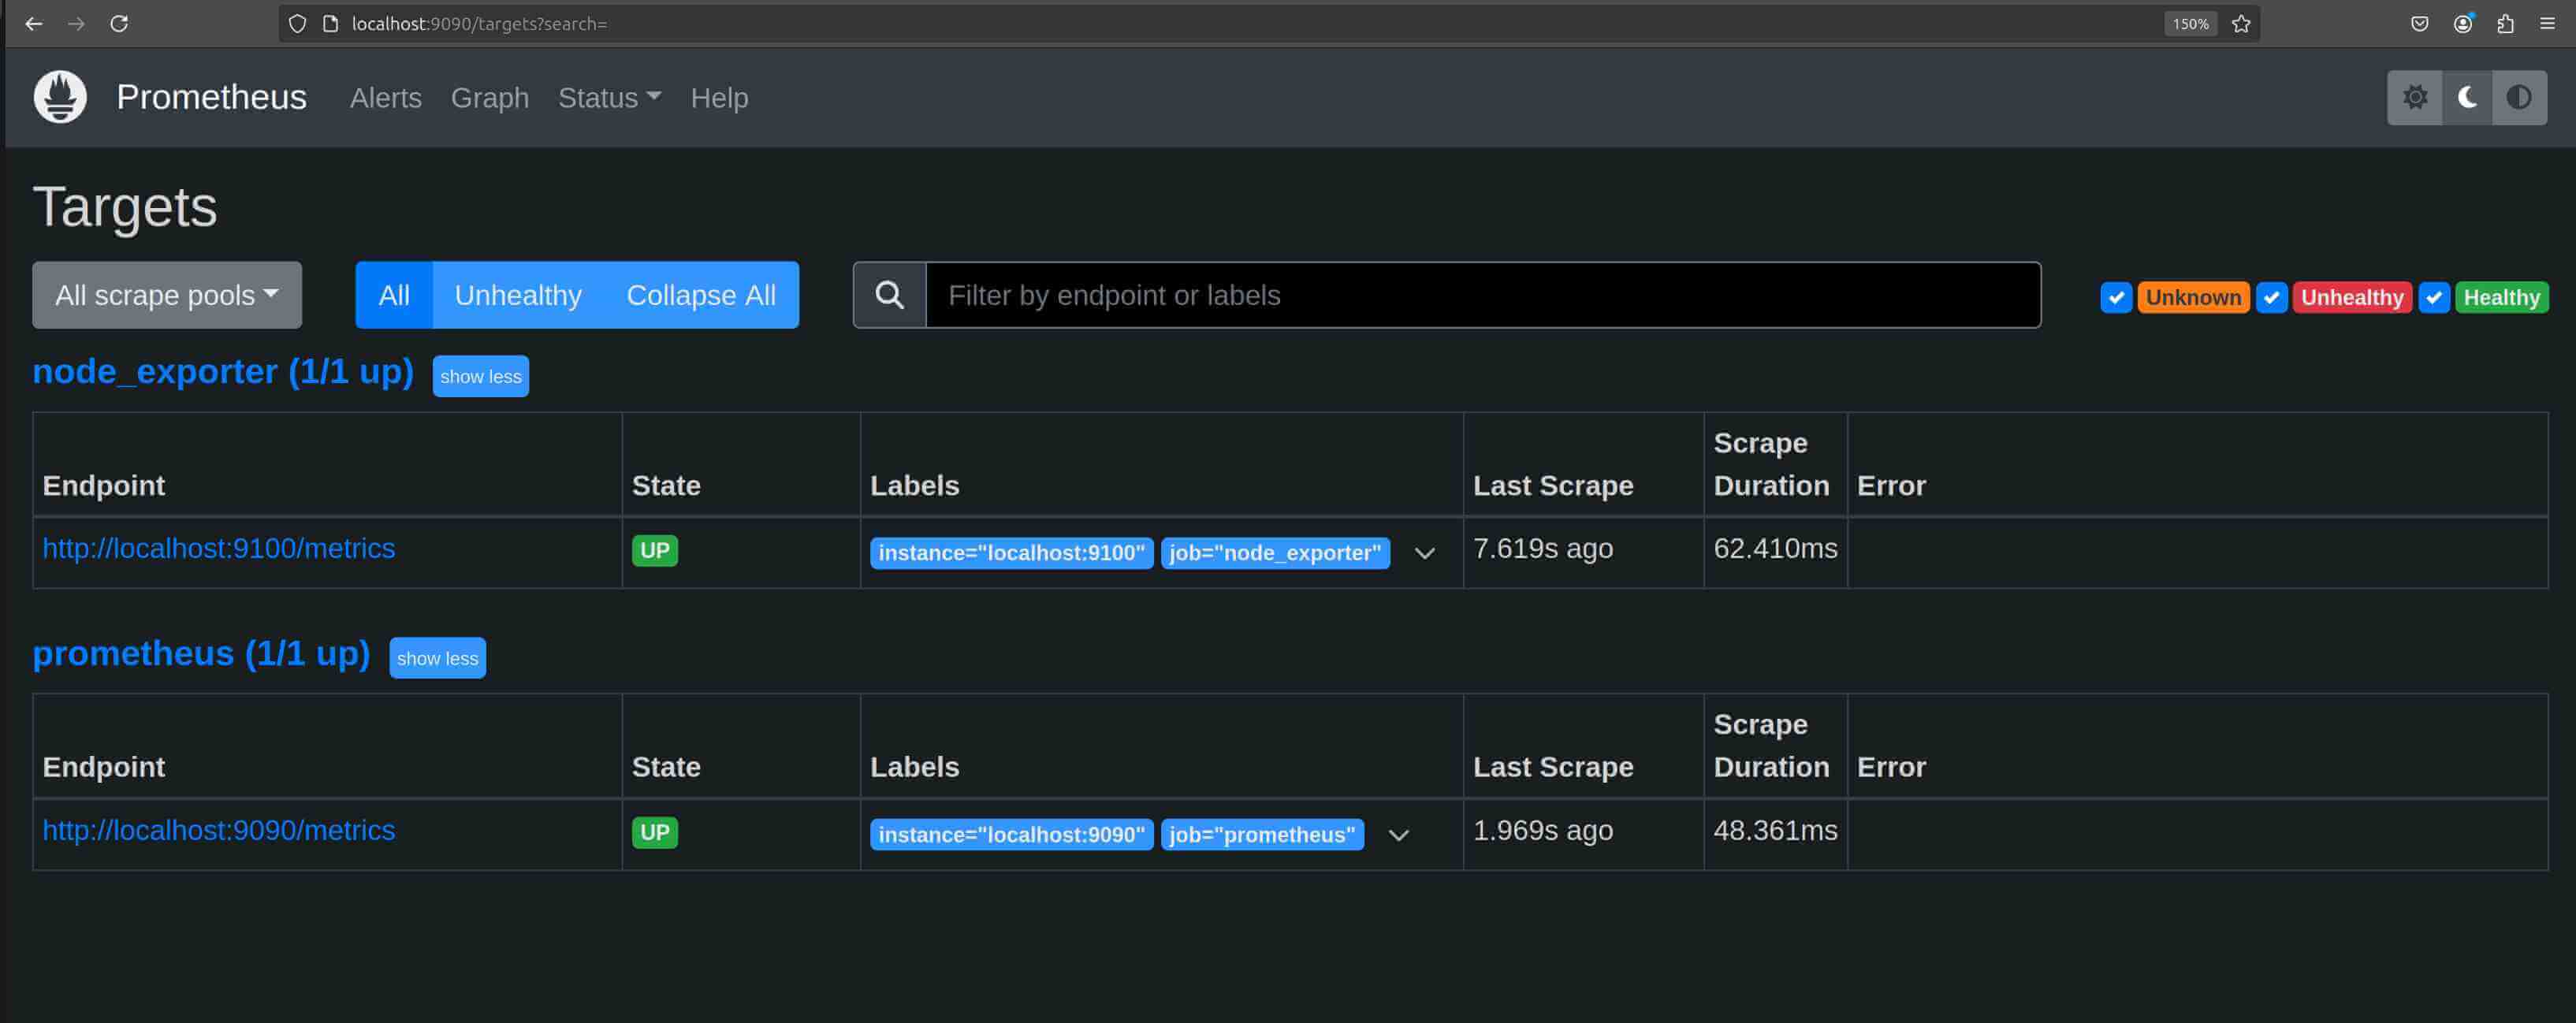
To confirm that Prometheus is collecting data from configured targets, go to Status > Targets:
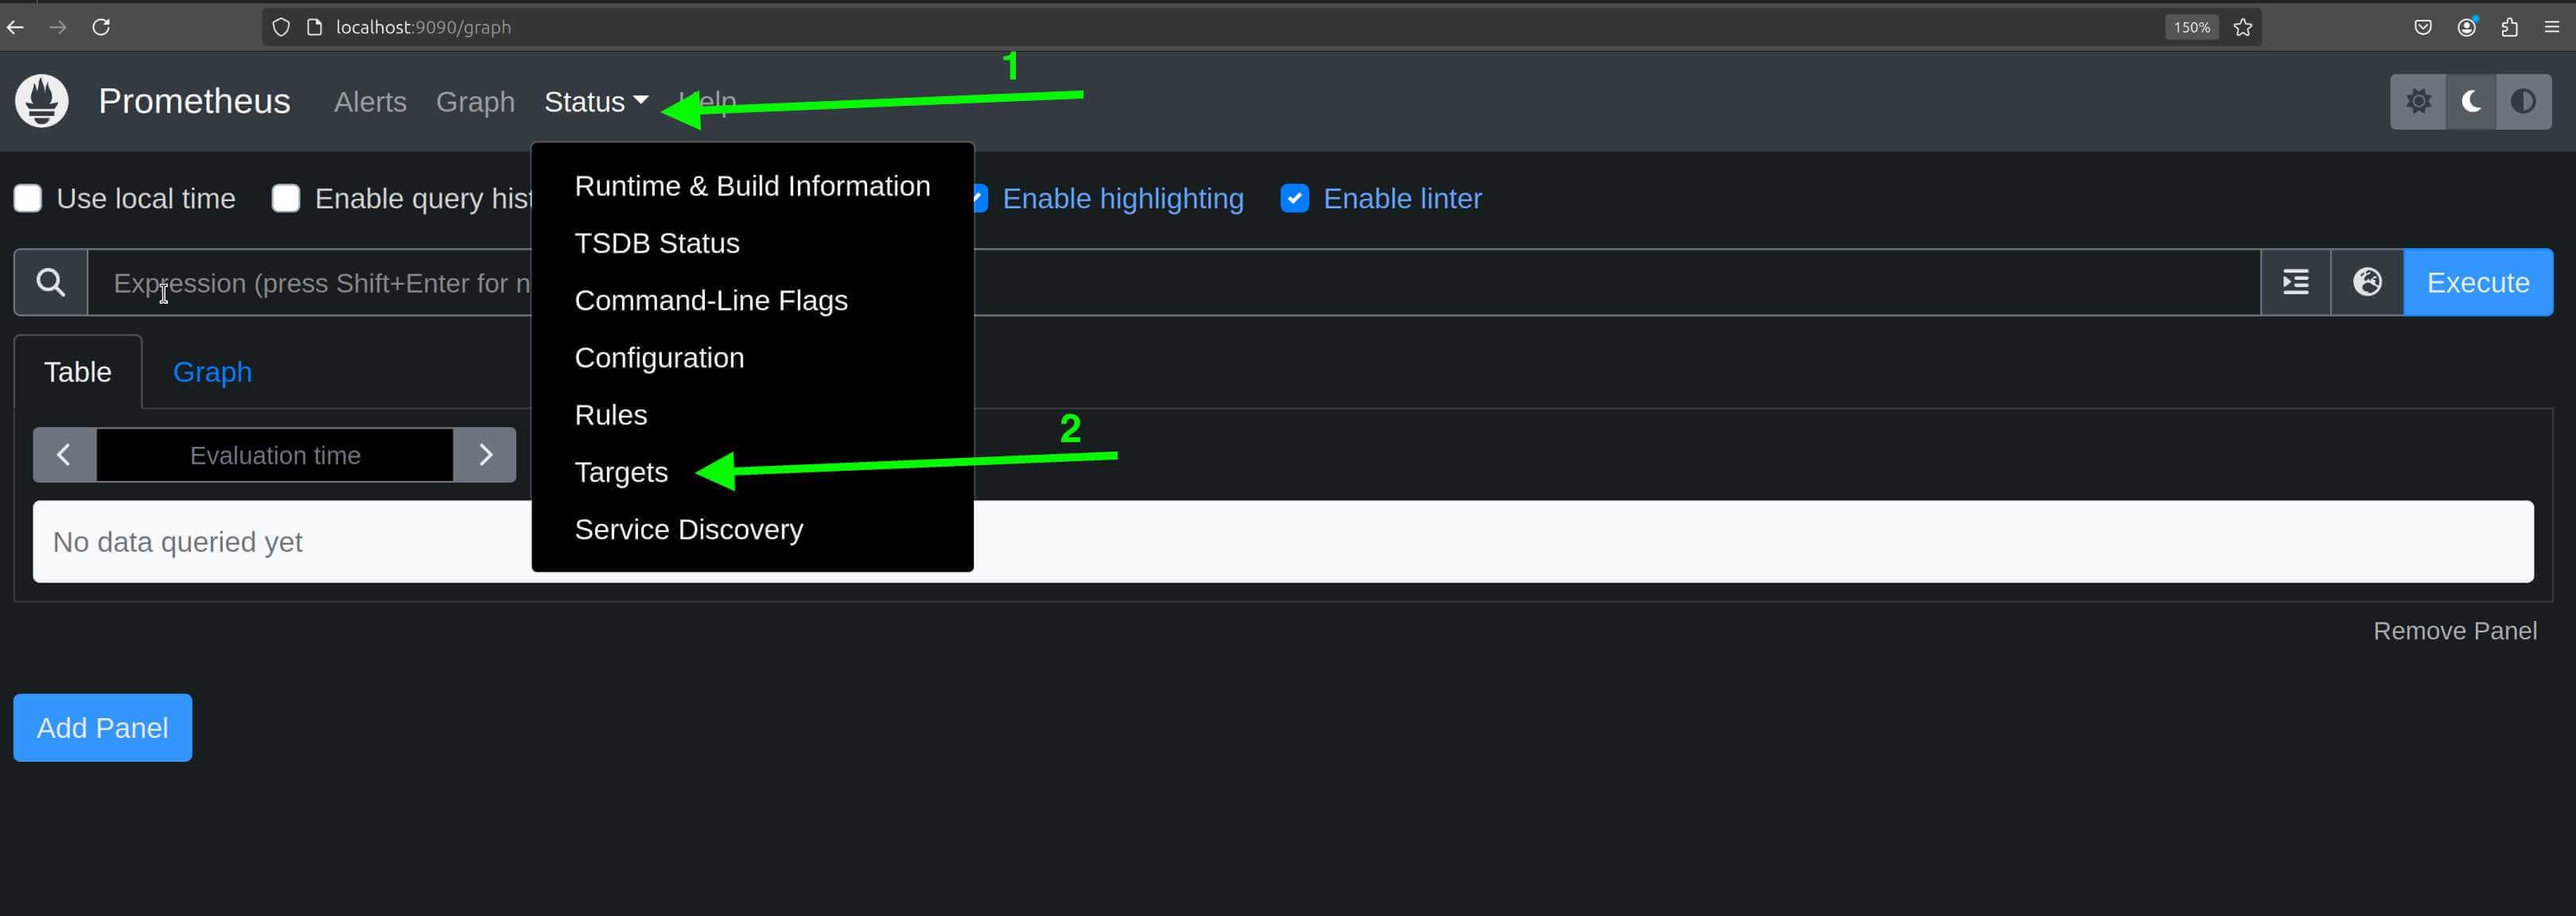 This page lists all targets Prometheus is monitoring along with their current status. It verifies that data collection is working as expected:
#Install Node Exporter
Node Exporter enables Prometheus to collect detailed system metrics such as CPU usage, memory, disk space, and network statistics. Follow these steps to install Node Exporter on your server.
#Step 1: Download Node Exporter
Firstly, download the latest version of Node Exporter. This tutorial uses version 1.8.2.
For 64-bit Intel/AMD systems (x86_64):
wget https://github.com/prometheus/node_exporter/releases/download/v1.8.2/node_exporter-1.8.2.linux-amd64.tar.gz
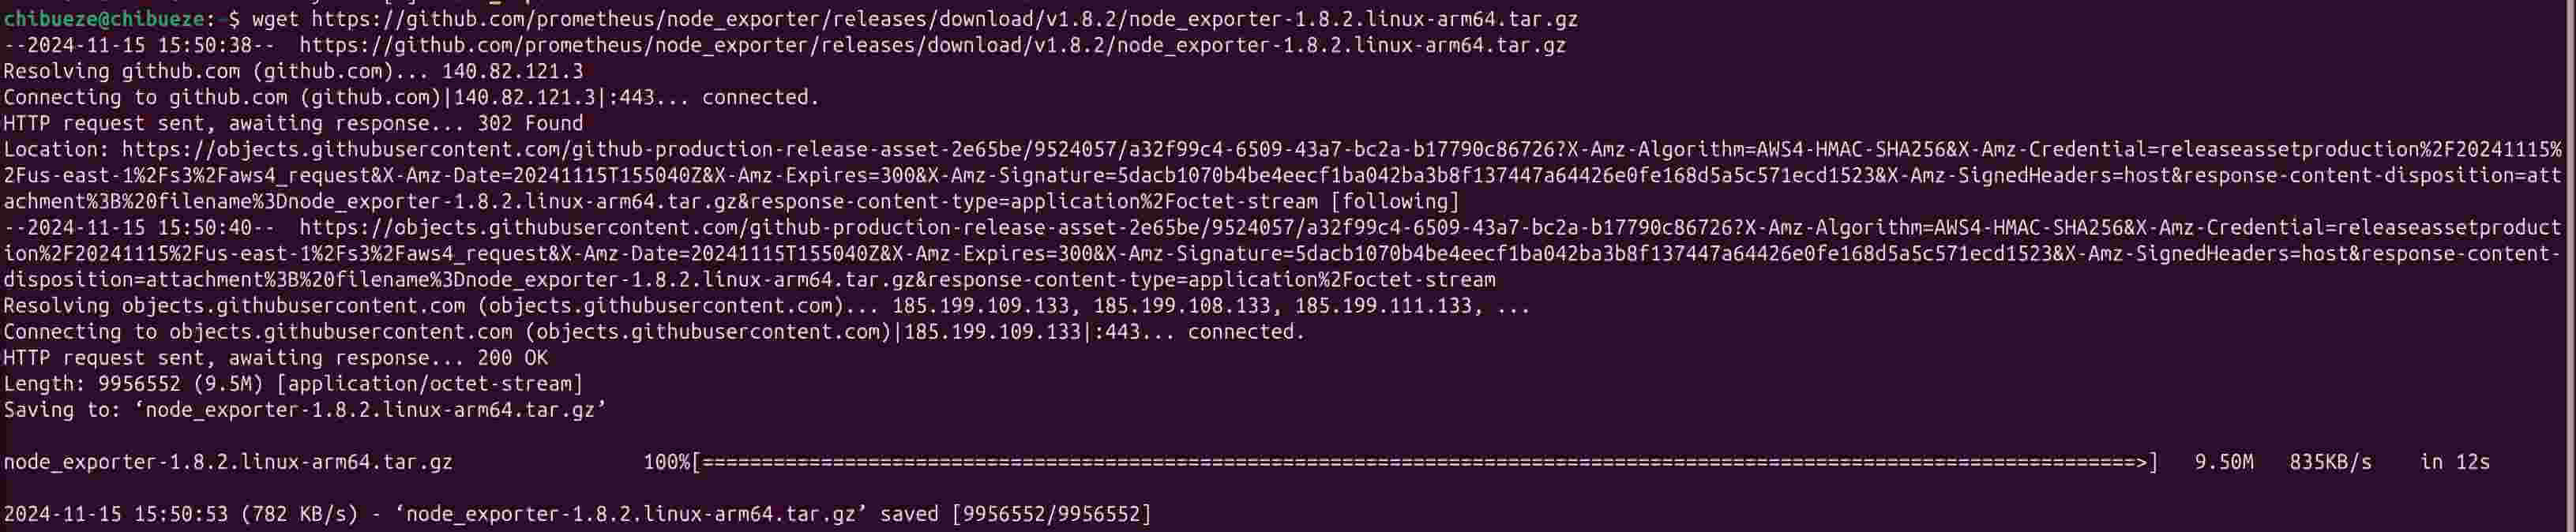
For ARM 64-bit systems (aarch64):
wget https://github.com/prometheus/node_exporter/releases/download/v1.8.2/node_exporter-1.8.2.linux-arm64.tar.gz
#Step 2: Extract the archive
After downloading Node Exporter, extract the contents of the archive.
Use this for 64-bit Intel/AMD systems (x86_64):
tar xvf node_exporter-1.8.2.linux-amd64.tar.gz
And this for ARM 64-bit systems (aarch64):
tar xvf node_exporter-1.8.2.linux-arm64.tar.gz
#Step 3: Move the binary to /usr/local/bin
To make Node Exporter easily accessible, move the binary file to /usr/local/bin.
For 64-bit Intel/AMD systems (x86_64):
sudo mv node_exporter-1.8.2.linux-amd64/node_exporter /usr/local/bin/
For ARM 64-bit systems (aarch64):
sudo mv node_exporter-1.8.2.linux-arm64/node_exporter /usr/local/bin/
#Step 4: Create a system user for Node Exporter
For security purposes, create a dedicated user for running Node Exporter:
sudo useradd -rs /bin/false node_exporter
#Step 5: Set up Node Exporter as a systemd service
To manage Node Exporter as a background service, create a new systemd service file:
sudo tee /etc/systemd/system/node_exporter.service > /dev/null <<EOF
[Unit]
Description=Node Exporter
Wants=network-online.target
After=network-online.target

[Service]
User=node_exporter
ExecStart=/usr/local/bin/node_exporter

[Install]
WantedBy=default.target
EOF
#Step 6: Start and enable Node Exporter
Reload systemd to recognize the new service, enable it to start on boot, and start Node Exporter.
sudo systemctl daemon-reload
sudo systemctl enable node_exporter
sudo systemctl start node_exporter
#Step 7: Verify Node Exporter is running
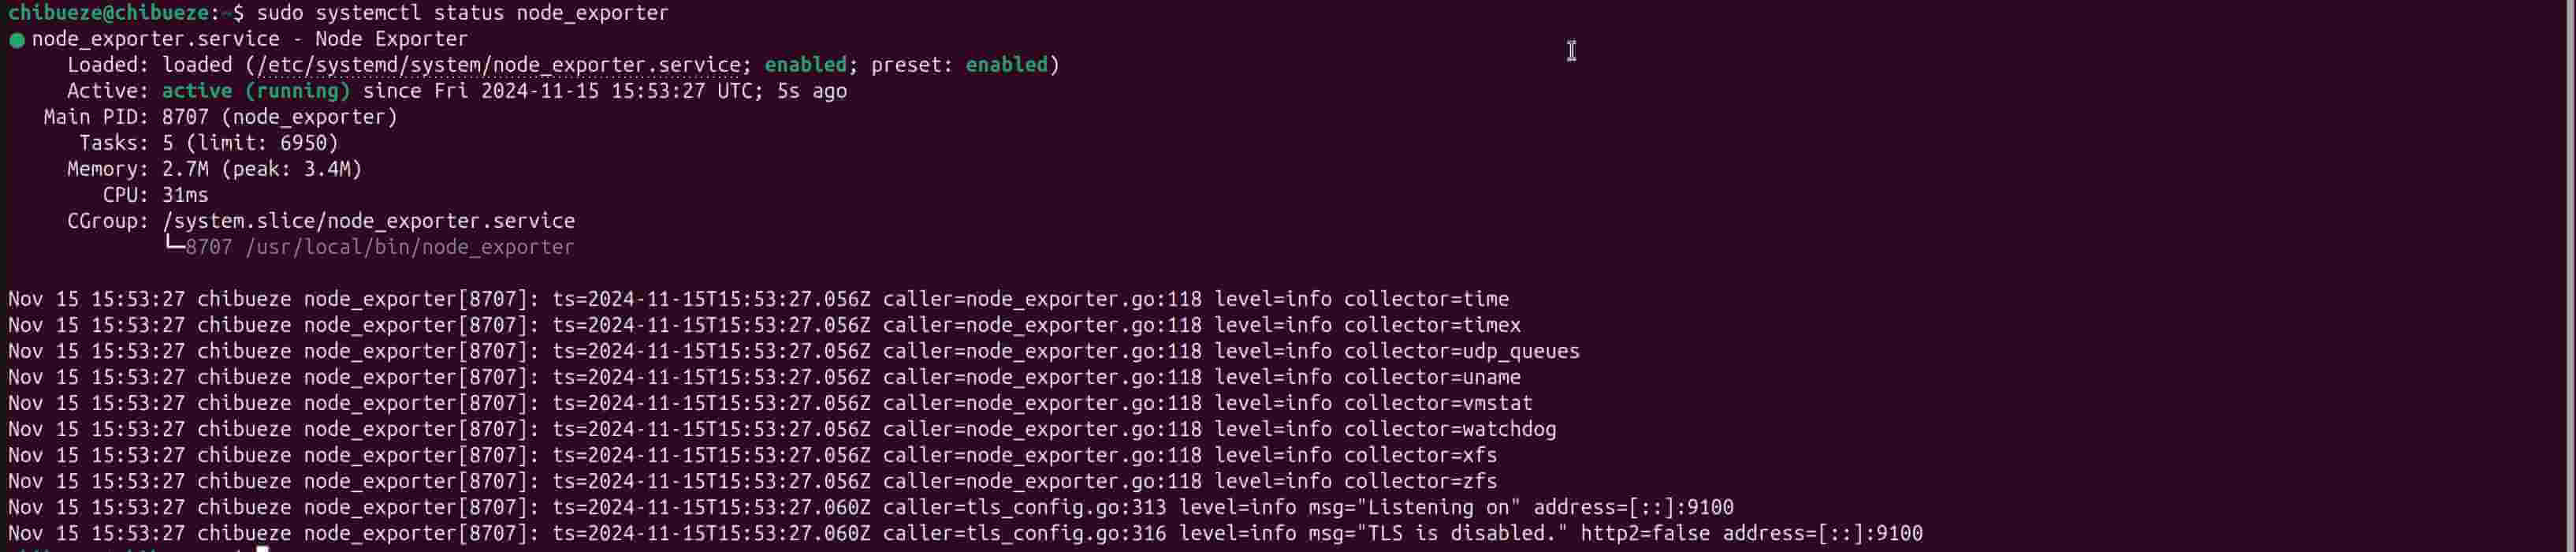
Check the status of Node Exporter to ensure it’s running correctly.
sudo systemctl status node_exporter
You should see a similar output to this:
#Step 8: Confirm Node Exporter is collecting metrics
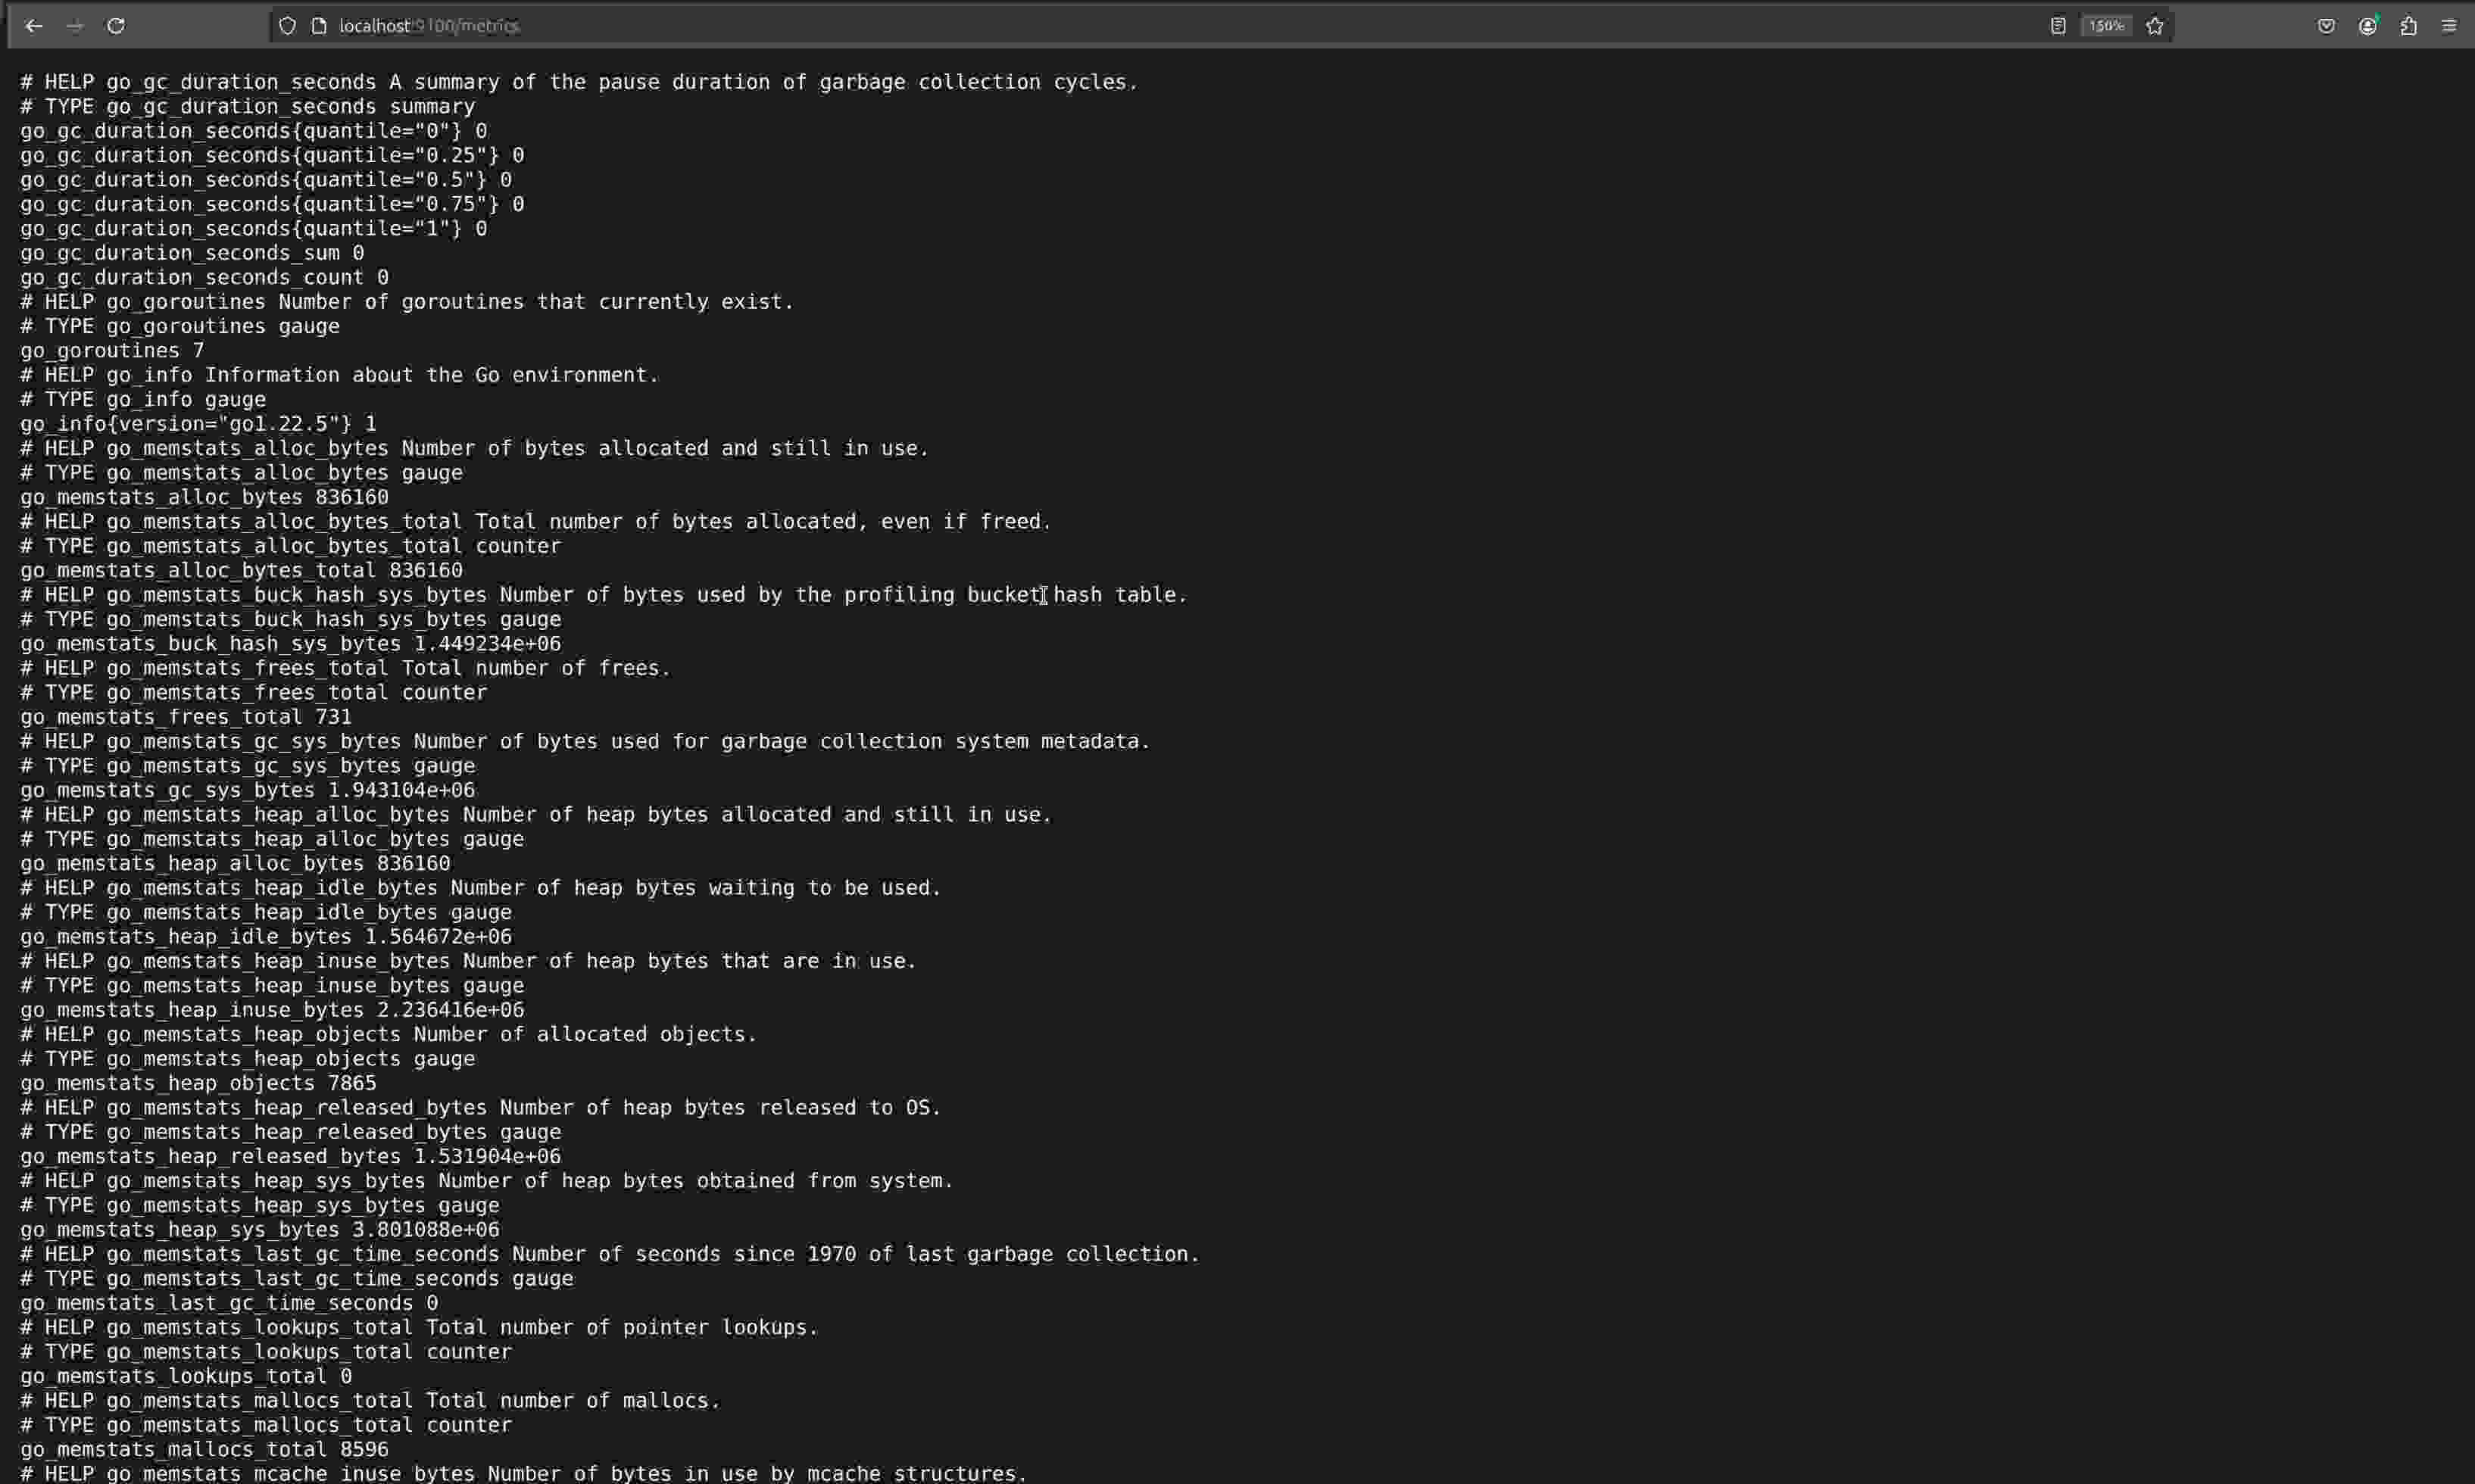
Once Node Exporter is running, you can confirm it’s collecting metrics by visiting http://localhost:9100/metrics in your web browser.
You should see a list of metrics being gathered, indicating that Node Exporter is working as expected:
#Add Node Exporter to Prometheus
To ensure Prometheus collects metrics from Node Exporter, you need to add Node Exporter as a target in the Prometheus configuration file.
-
Edit the Prometheus Configuration File:
Open the
prometheus.ymlfile (usually located at/etc/prometheus/prometheus.yml):sudo nano /etc/prometheus/prometheus.yml -
Add Node Exporter as a Target:
In the
scrape_configssection of the configuration file, add a job for Node Exporter. It should look something like this:scrape_configs: - job_name: "prometheus" static_configs: - targets: ["localhost:9090"] - job_name: "node_exporter" static_configs: - targets: ["localhost:9100"] -
Save and Close the File:
If you’re using
nano, pressCTRL + X, thenYto confirm, andEnterto save. -
Restart Prometheus:
After updating the configuration, restart Prometheus to apply the changes:
sudo systemctl restart prometheus -
Verify Node Exporter in Prometheus:
Go to Prometheus’s web interface by visiting http://localhost:9090, then navigate to Status > Targets. You should see Node Exporter listed as a target with the endpoint
localhost:9100:
#Install Grafana
With Prometheus and Node exporter configured and running, the next step is to set up Grafana.
#What is Grafana?
Grafana is an open-source platform that allows you to create customizable dashboards and set up alerts, providing a real-time visual representation of your metric data. When integrated with Prometheus, Grafana makes it easy to visualize system metrics on personalized dashboards, helping you troubleshoot issues and gain insights at a glance.
In this section, you’ll install Grafana locally, giving you full control over your data. If you prefer a quicker setup, you also have the option to use Grafana Cloud, which doesn’t require local installation.
Follow these steps to install Grafana:
#Step 1: Add the Grafana GPG key
Grafana's packages are signed to ensure authenticity. You need to add Grafana's GPG key to your system to verify these packages.
-
Install required packages:
Before adding the GPG key, ensure your system has the necessary packages for handling HTTPS repositories and software properties:
sudo apt-get install -y apt-transport-https software-properties-commonThe above command installs
apt-transport-httpsfor secure HTTP access to repositories andsoftware-properties-commonfor managing repository sources. -
Create the keyrings directory:
Create a dedicated directory to store the GPG key for better organization and to follow security best practices:
sudo mkdir -p /etc/apt/keyrings/This command creates the /etc/apt/keyrings/ directory if it doesn’t already exist.
-
Download and store the Grafana GPG key:
Run the following command to get Grafanas GPG key:
wget -q -O - https://apt.grafana.com/gpg.key | gpg --dearmor | sudo tee /etc/apt/keyrings/grafana.gpg > /dev/nullThis command performs multiple steps in one line:
wget -q -O -downloads the Grafana GPG key quietly and outputs it to standard output.gpg --dearmorconverts the key to a binary format compatible with APT.sudo tee /etc/apt/keyrings/grafana.gpg > /dev/nullsaves the key in/etc/apt/keyrings/grafana.gpgwithout printing output to the terminal.
Your system is now set up to verify Grafana’s packages during installation.
#Step 2: Add the Grafana APT repository
With the GPG key added, run the following command to add the Grafana repository to your system’s package sources:
echo "deb [signed-by=/etc/apt/keyrings/grafana.gpg] https://apt.grafana.com stable main" | sudo tee /etc/apt/sources.list.d/grafana.list > /dev/null
This command does the following:
- The
echocommand displays the line"deb [signed-by=/etc/apt/keyrings/grafana.gpg] [https://apt.grafana.com](https://apt.grafana.com/) stable main", which is the entry for the Grafana repository. [signed-by=/etc/apt/keyrings/grafana.gpg]ensures that only packages signed by the Grafana GPG key are trusted.| sudo tee /etc/apt/sources.list.d/grafana.list > /dev/nulldirects the information, from theechocommand to a file calledgrafana.listwithin the/etc/apt/sources.list.d/folder.> /dev/nullsilences any additional output.
With this repository added, APT can now find and download Grafana packages directly from the official repository. This links your package manager to the source of the Grafana software, enabling installation, updates, and dependency management through APT.
#Step 3: Install Grafana
Follow these steps to install Grafana: Firstly, refresh your system’s package list:
sudo apt-get update
Now, install Grafana using the APT package manager:
sudo apt-get install grafana
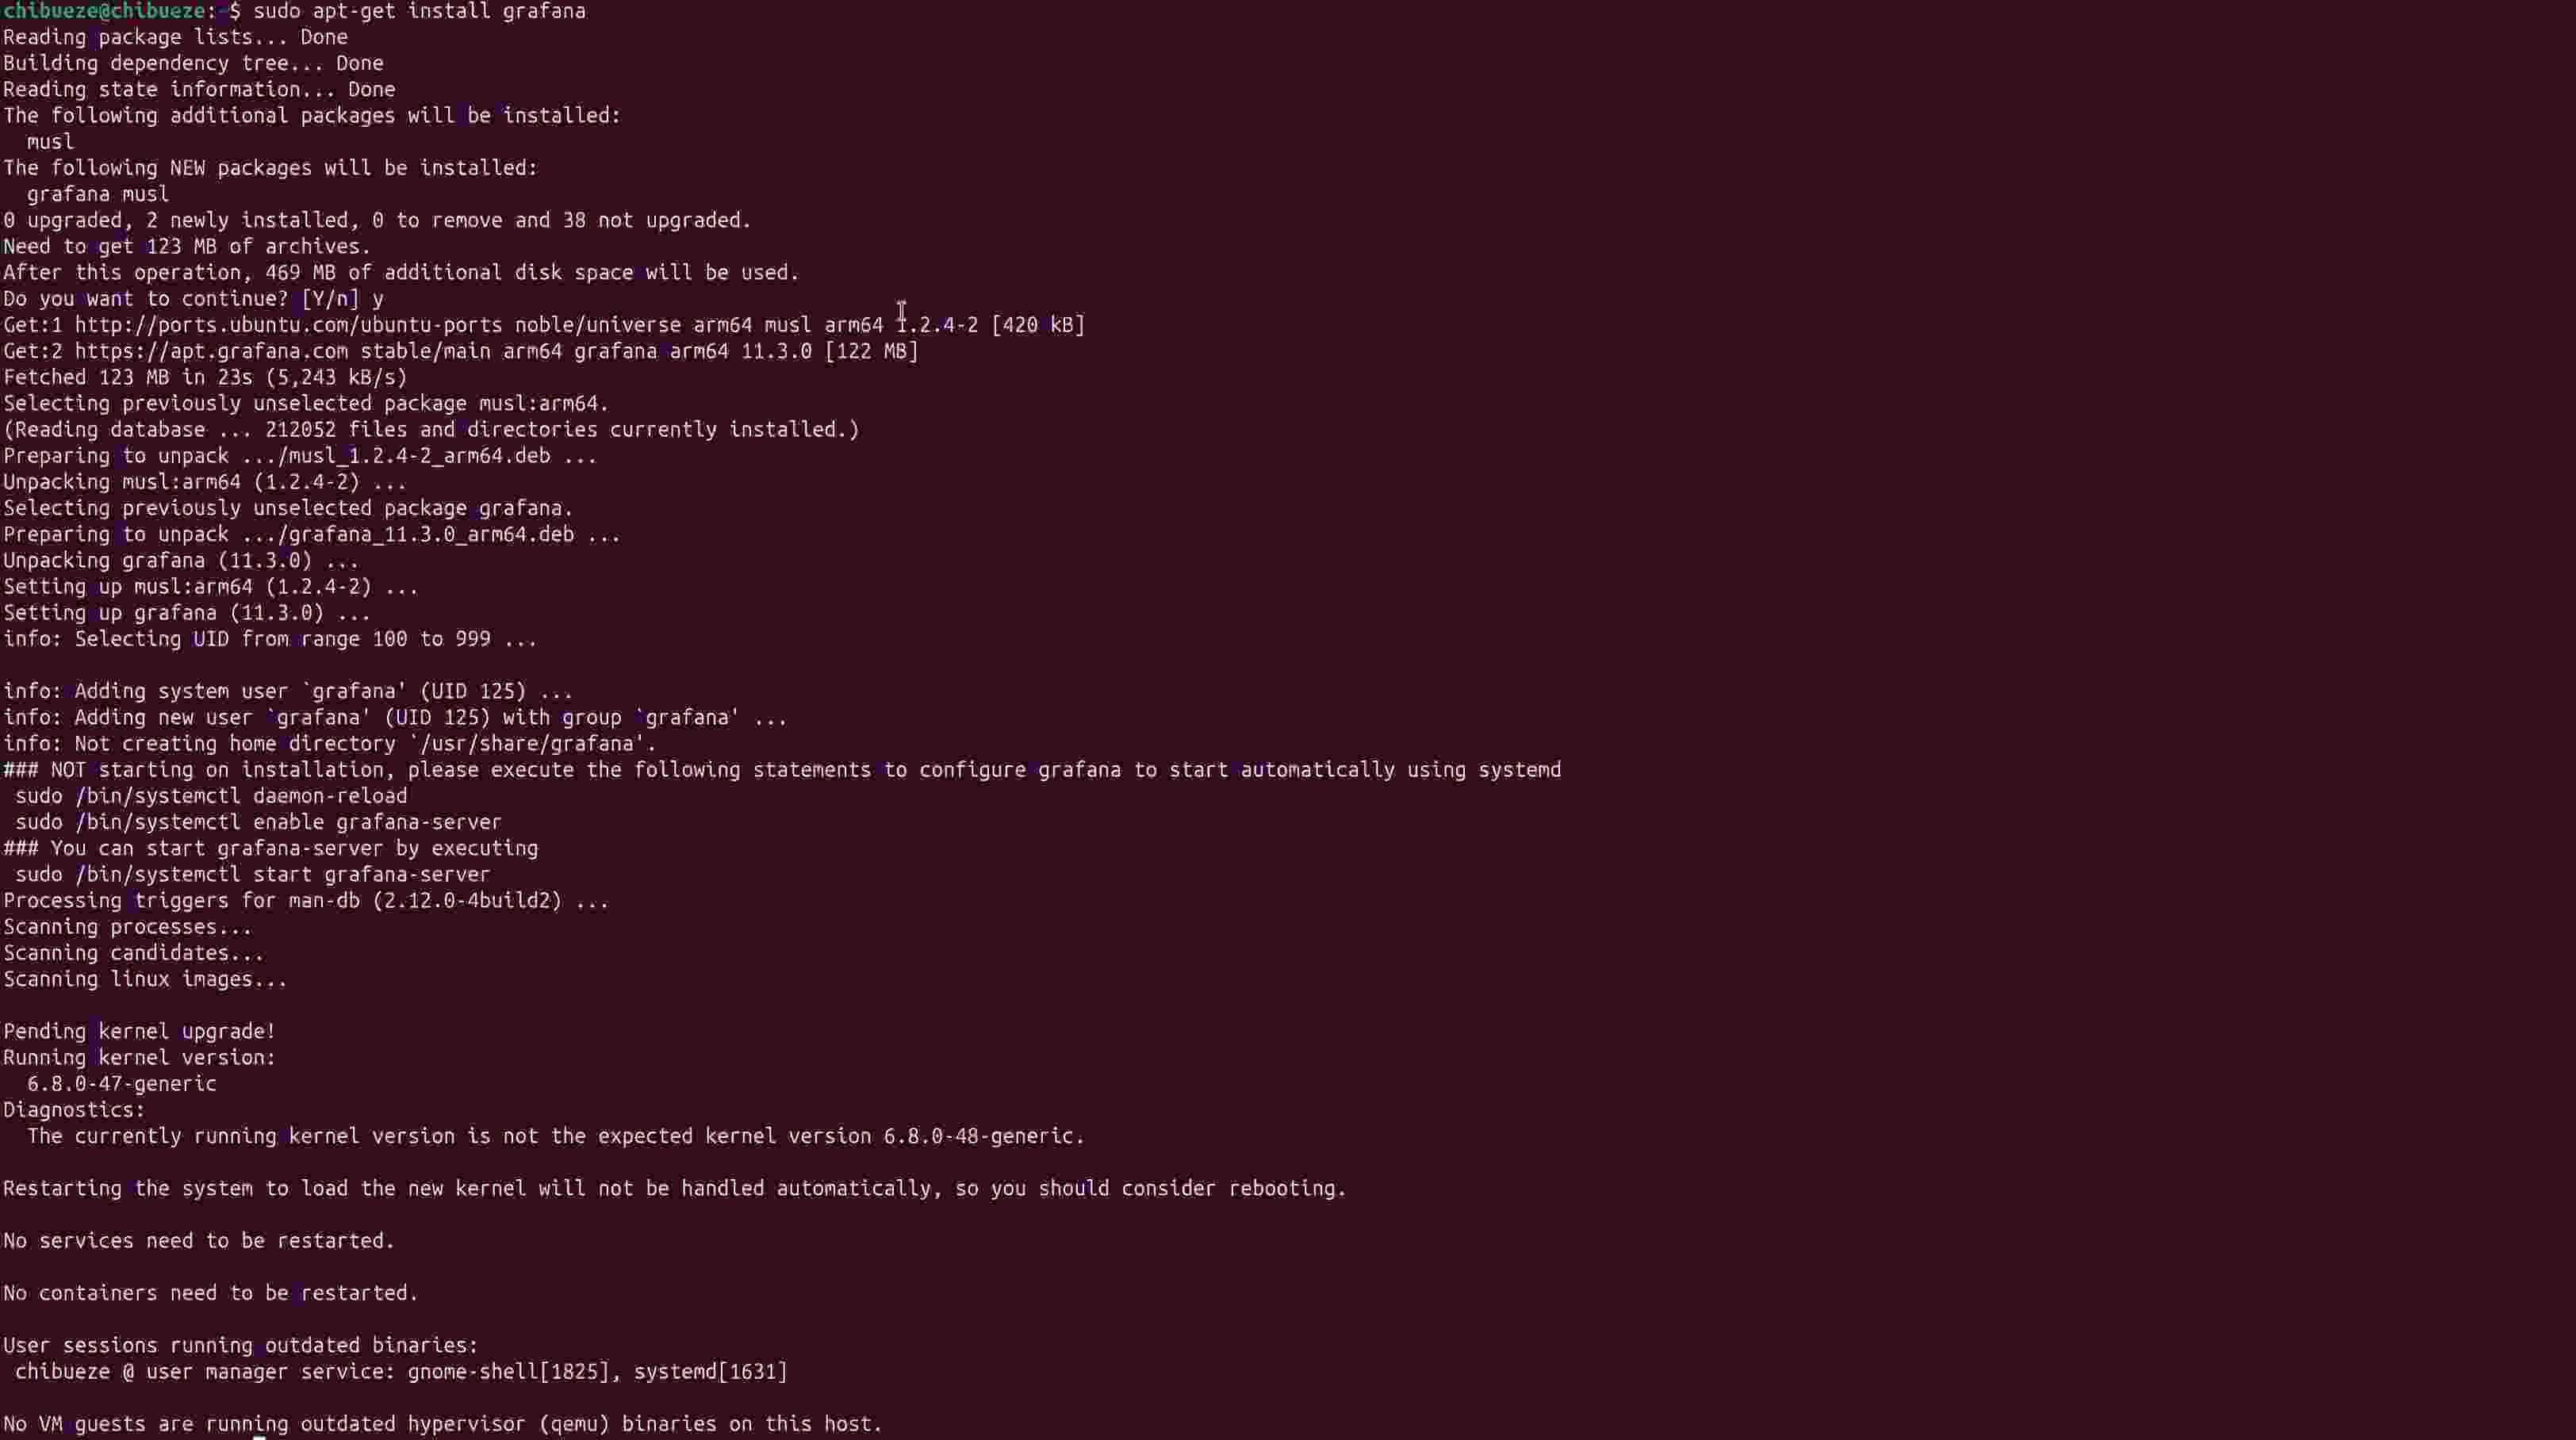 This command downloads and installs Grafana along with any necessary dependencies.
#Step 4: Start and enable the Grafana service
With Grafana installed, you need to start and configure it to run automatically on boot.
-
Start the Grafana Service:
Use the following command to start Grafana:
sudo systemctl start grafana-serverThis command initiates Grafana, making it accessible through your server.
-
Enable Grafana to start on boot:
To have Grafana automatically start every time your server reboots, enable it with this command:
sudo systemctl enable grafana-serverThis ensures continuous access to monitoring dashboards without manual intervention.
-
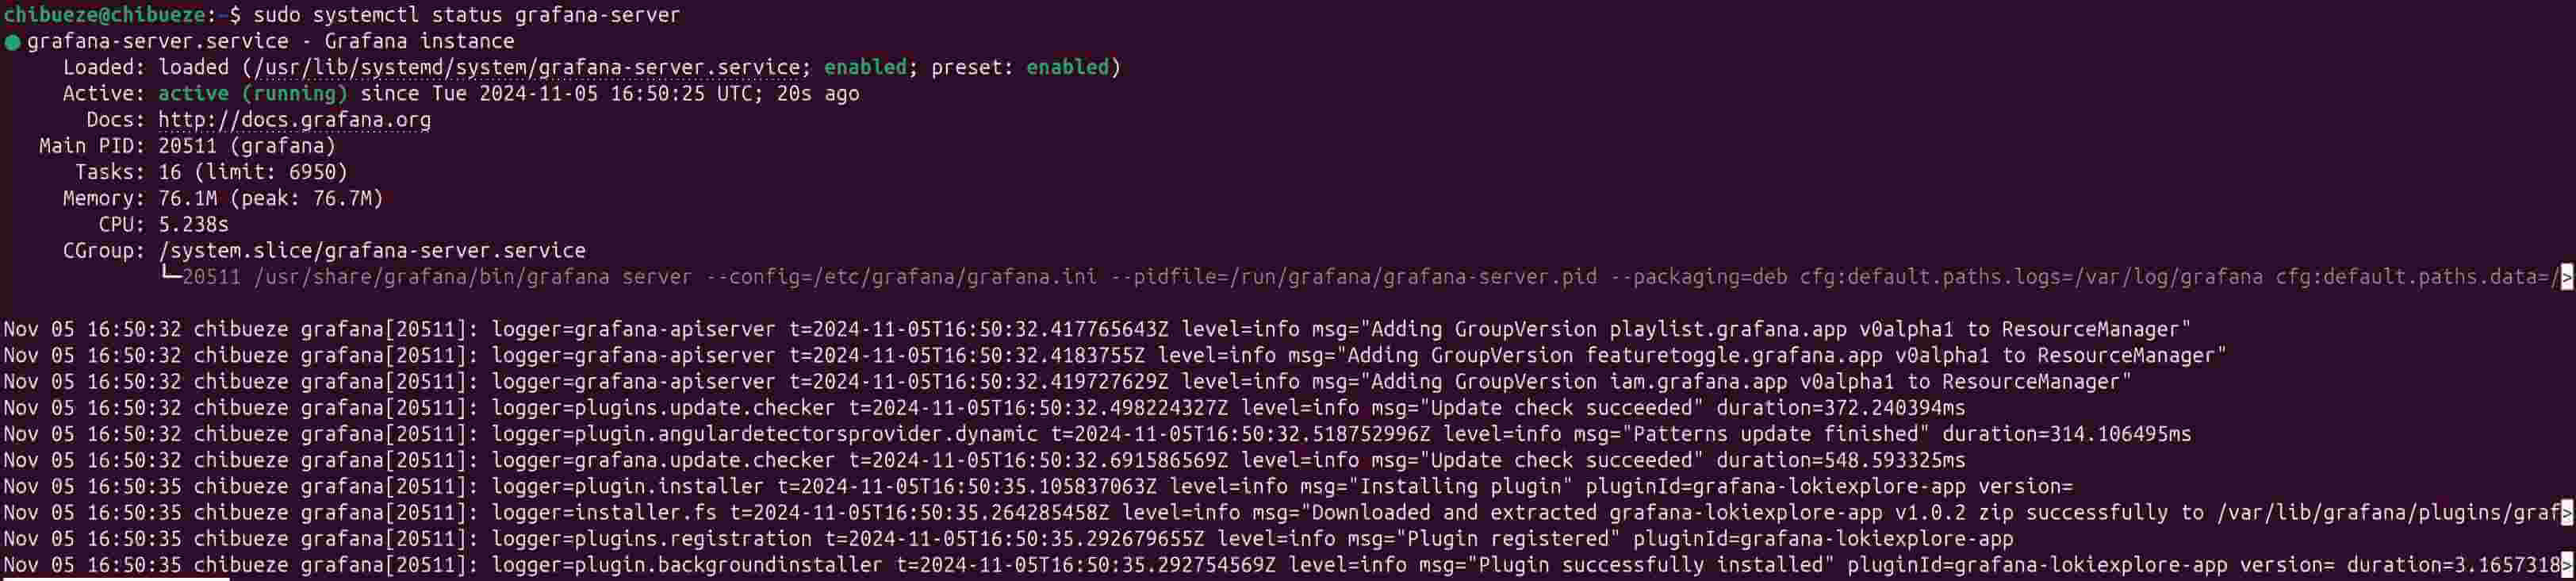
Check Grafana’s status:
Verify that Grafana is running correctly with this command:
sudo systemctl status grafana-serverThis command displays the status of the Grafana service. If Grafana is running successfully, you’ll see a similar output to this:

With Grafana now active, you can proceed to access its web interface, where you’ll manage dashboards and connect them to Prometheus.
#Step 5: Open the Grafana web interface
You can now access Grafana’s web interface on port 3000. Follow these steps:
-
Allow port 3000 through the firewall (optional):
If your firewall (like UFW) is active, open port
3000to allow incoming traffic:sudo ufw allow 3000/tcp -
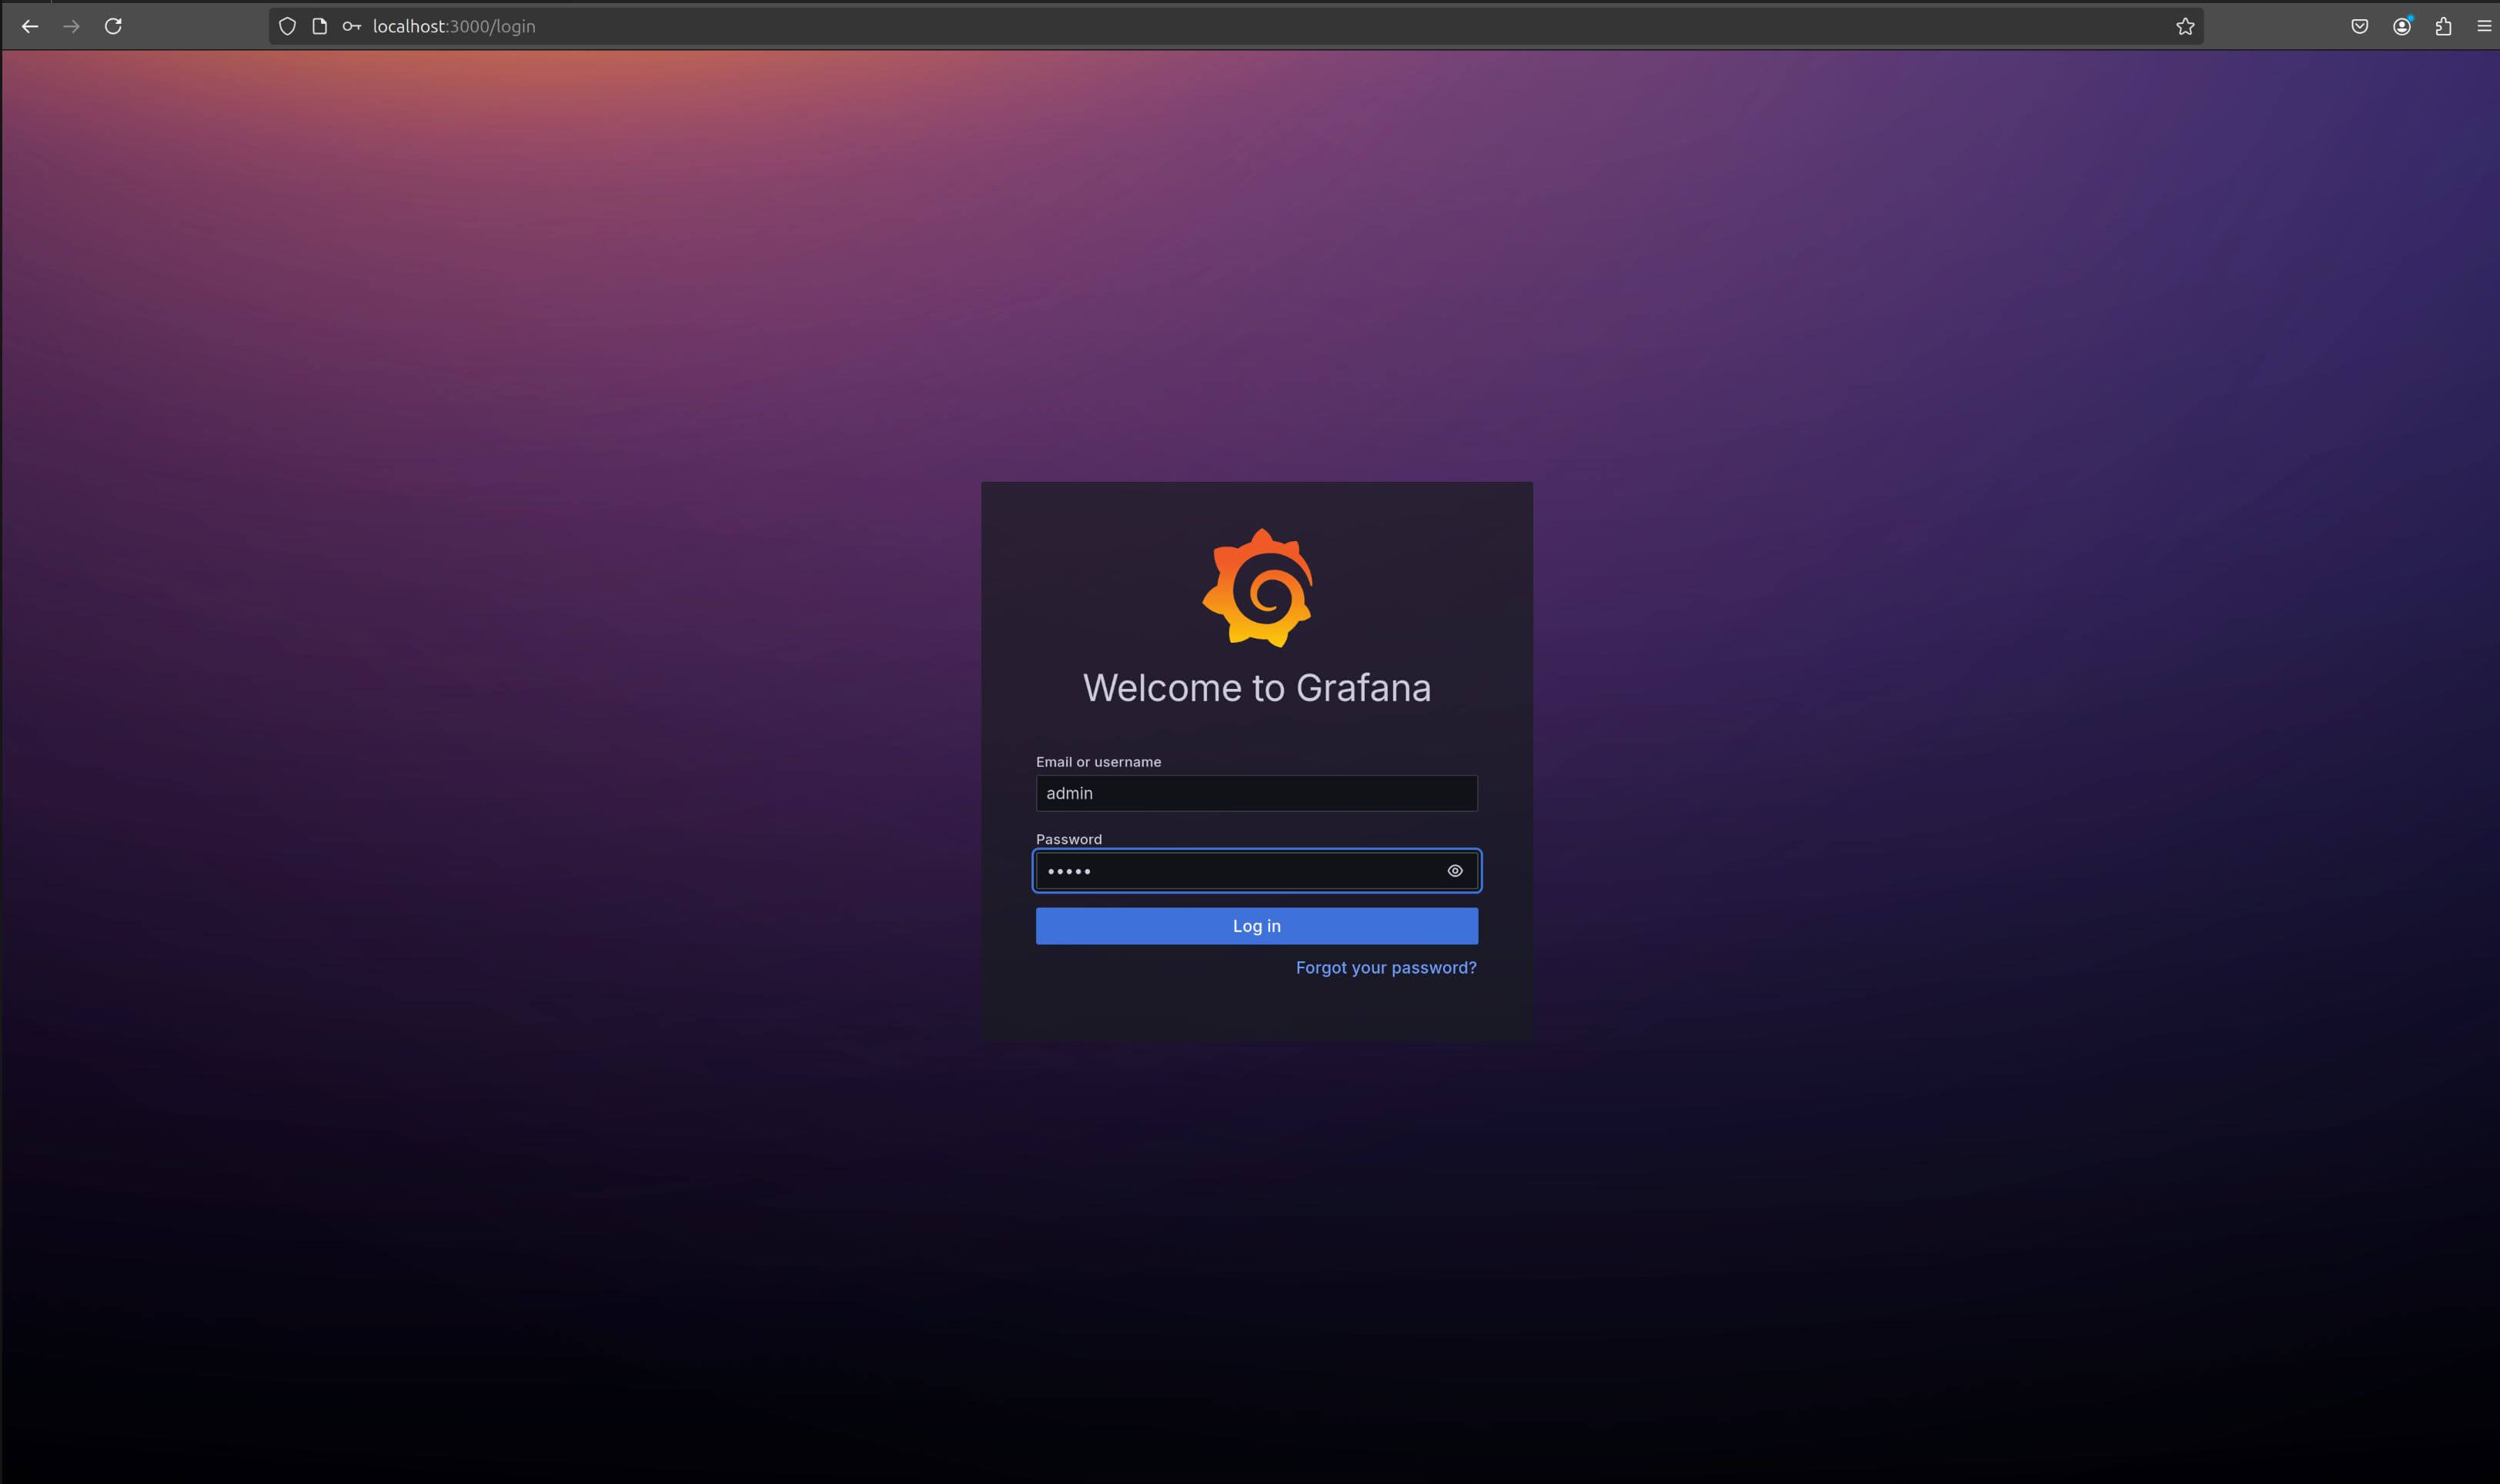
Log in to Grafana:
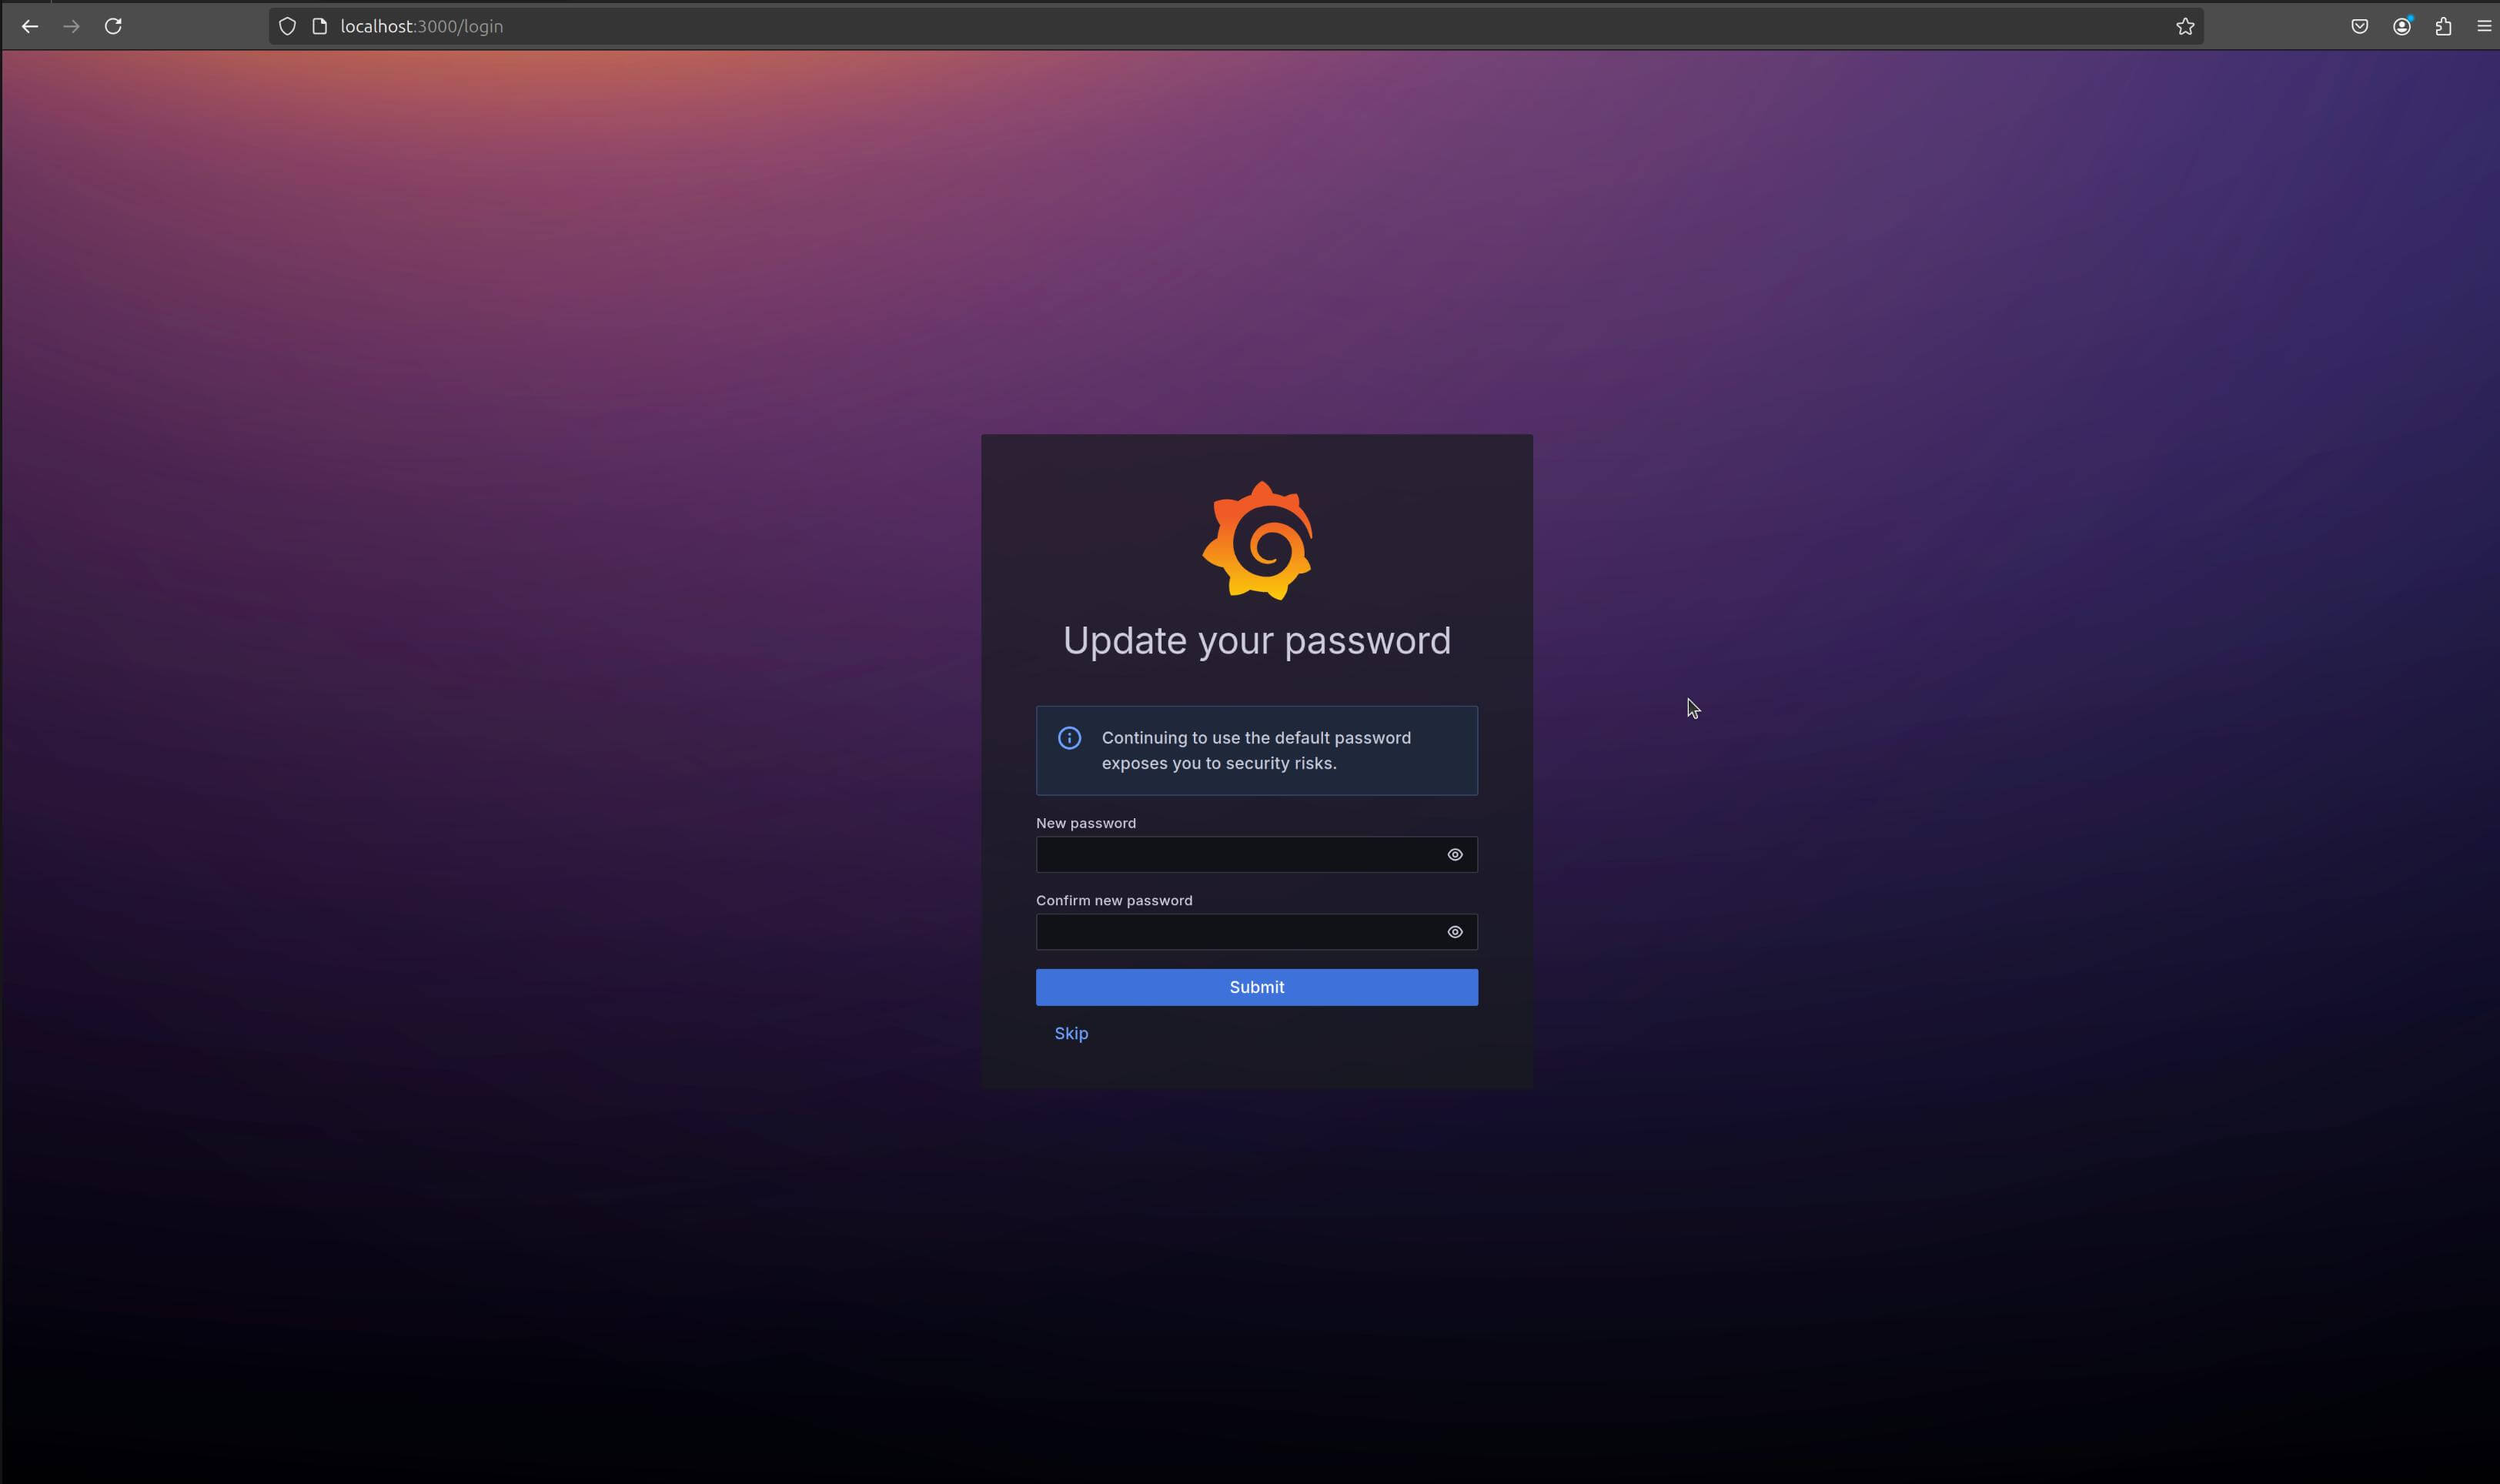
Visit http://localhost:3000 on a web browser. Once loaded, you should see the Grafana login screen. Login using the default username and password—
admin. After entering these credentials, Grafana will prompt you to change the default password:
Once you’ve logged in and changed the password, Grafana is ready to be configured to connect with Prometheus.
After entering these credentials, Grafana will prompt you to change the default password:
Once you’ve logged in and changed the password, Grafana is ready to be configured to connect with Prometheus.
#Set up Grafana and connect to Prometheus
It’s time to set up Grafana and connect it to Prometheus.
#Basic Grafana configuration
Firstly, log in to Grafana if you haven’t already. Then, if desired, you can set some basic preferences by clicking on the Administration sidebar option:
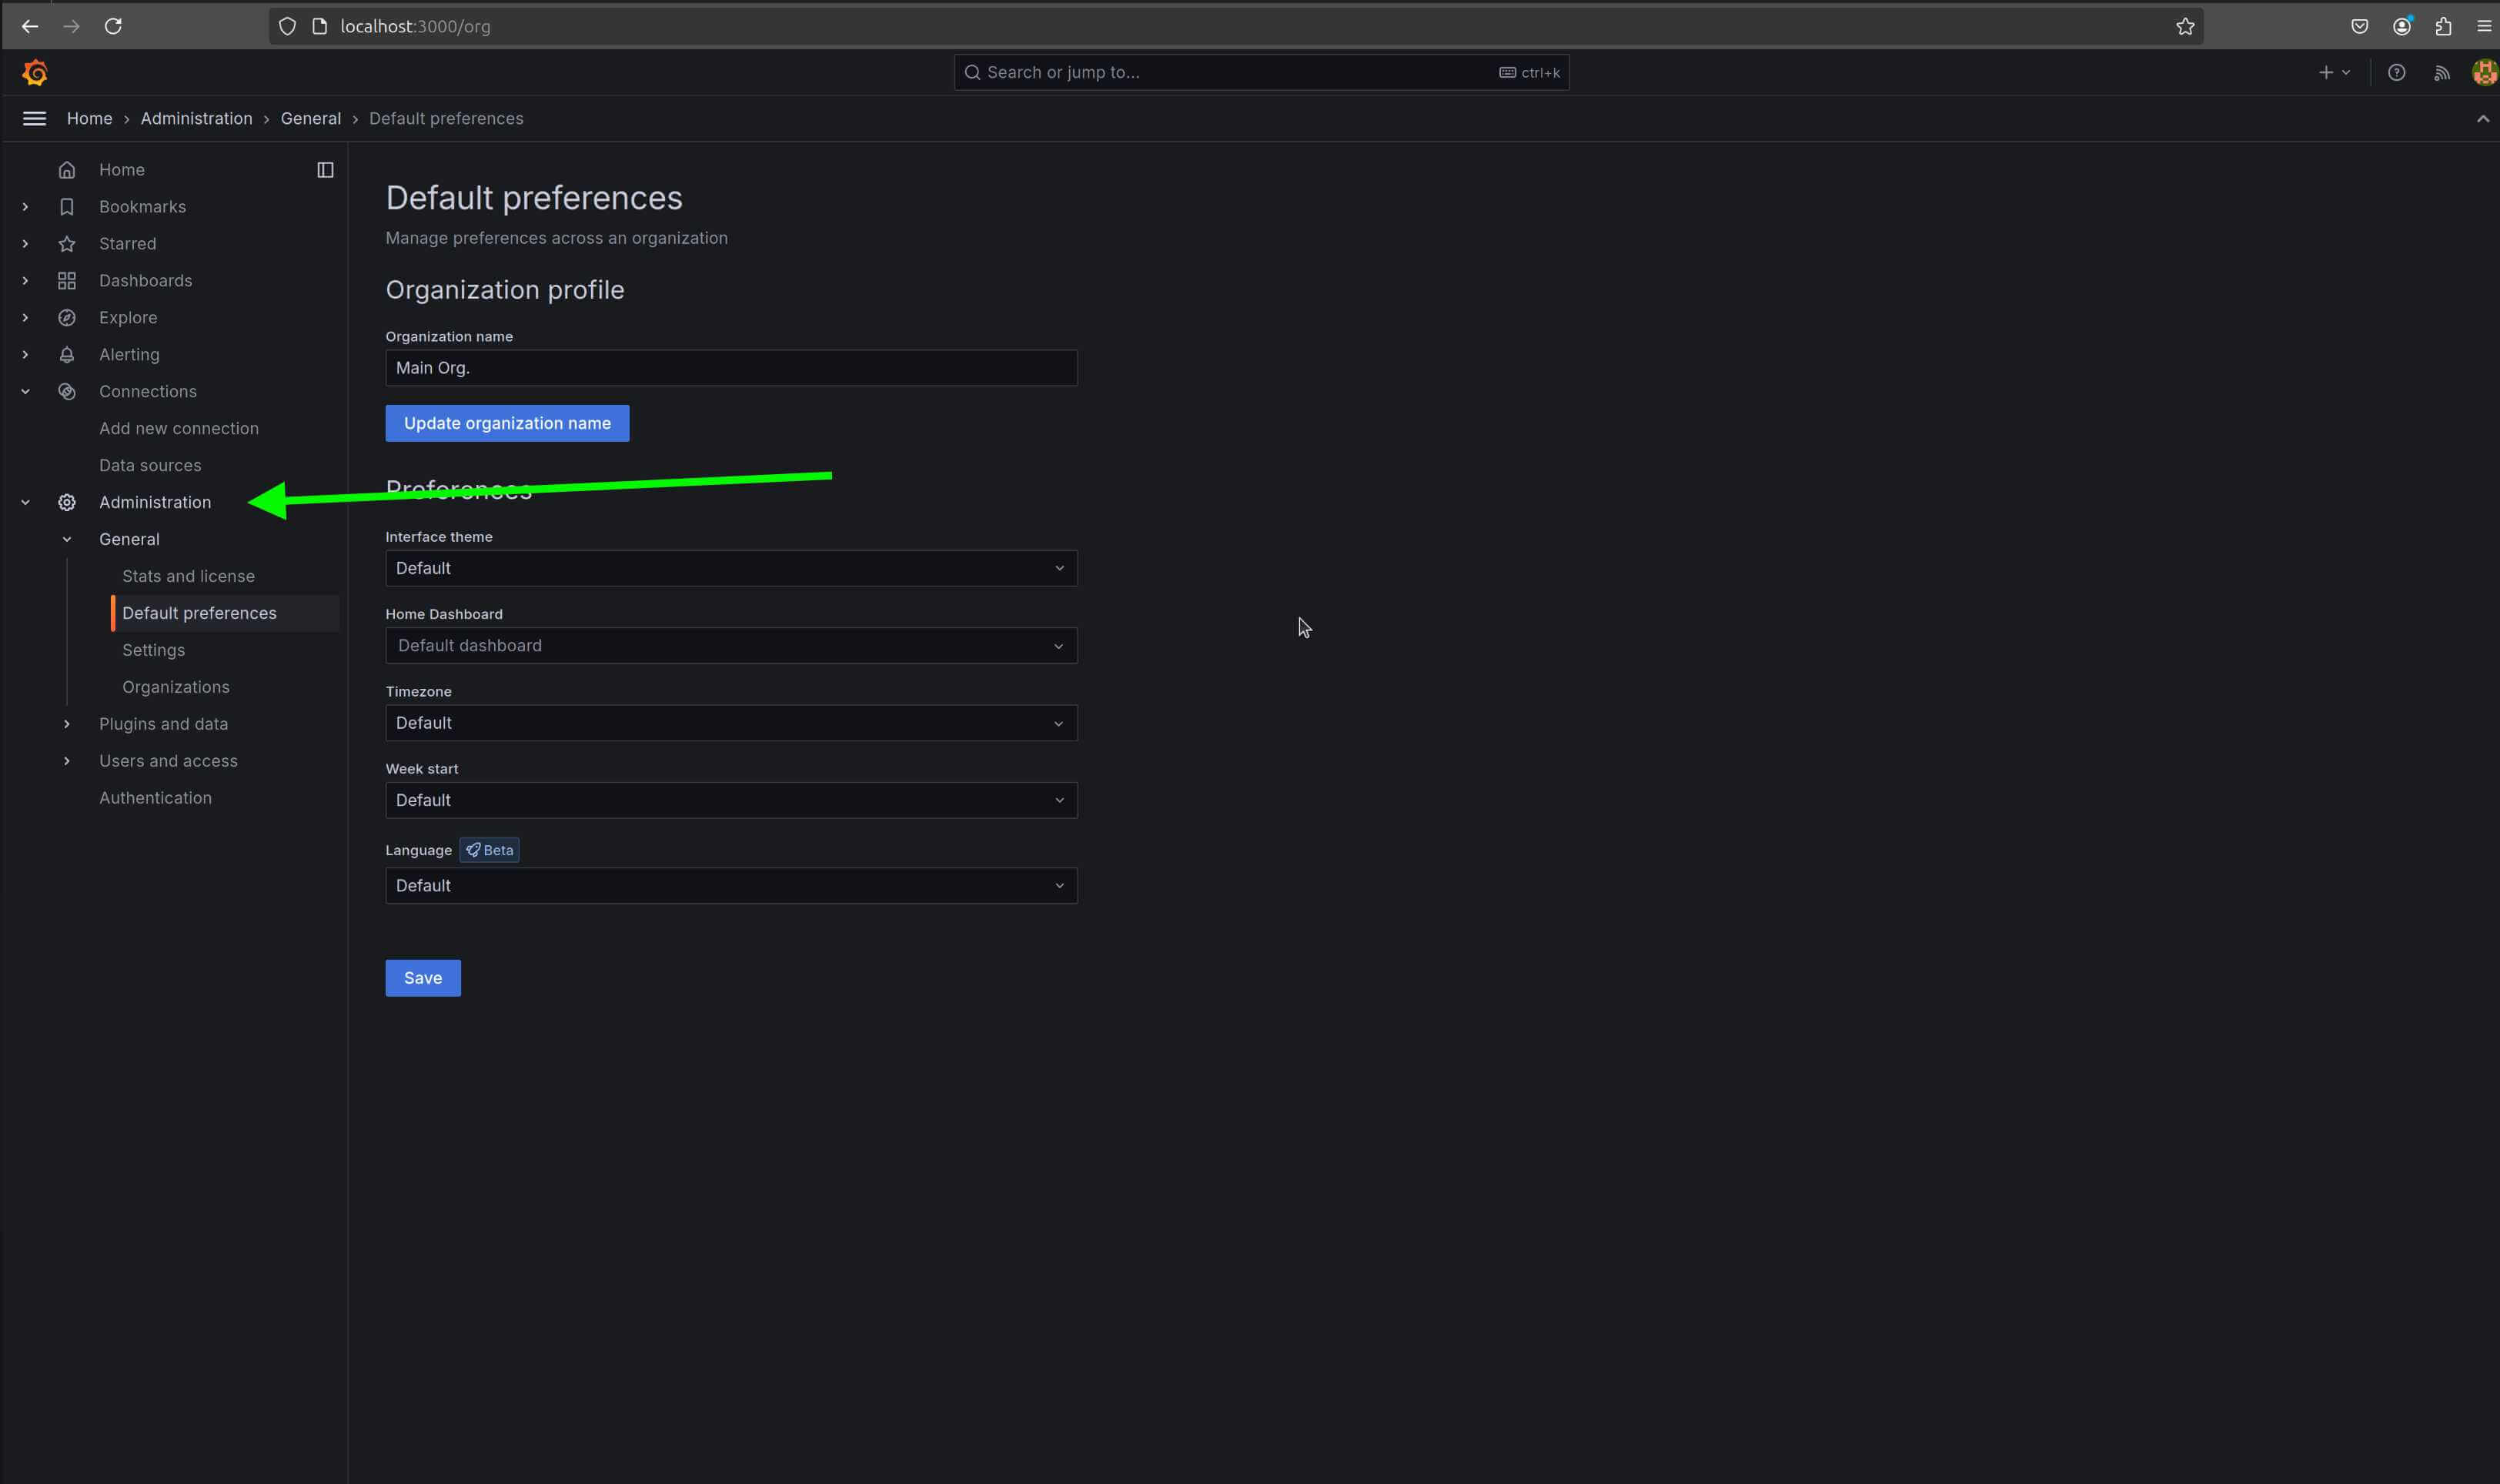 Here, you can change default preferences like the organization name, timezone, and UI theme. Setting the timezone can be helpful if your metrics rely on specific time-based data points.
#Adding Prometheus as a data source in Grafana
To view data from Prometheus, you need to add it as a data source in Grafana. This allows Grafana to pull metrics data directly from Prometheus.
-
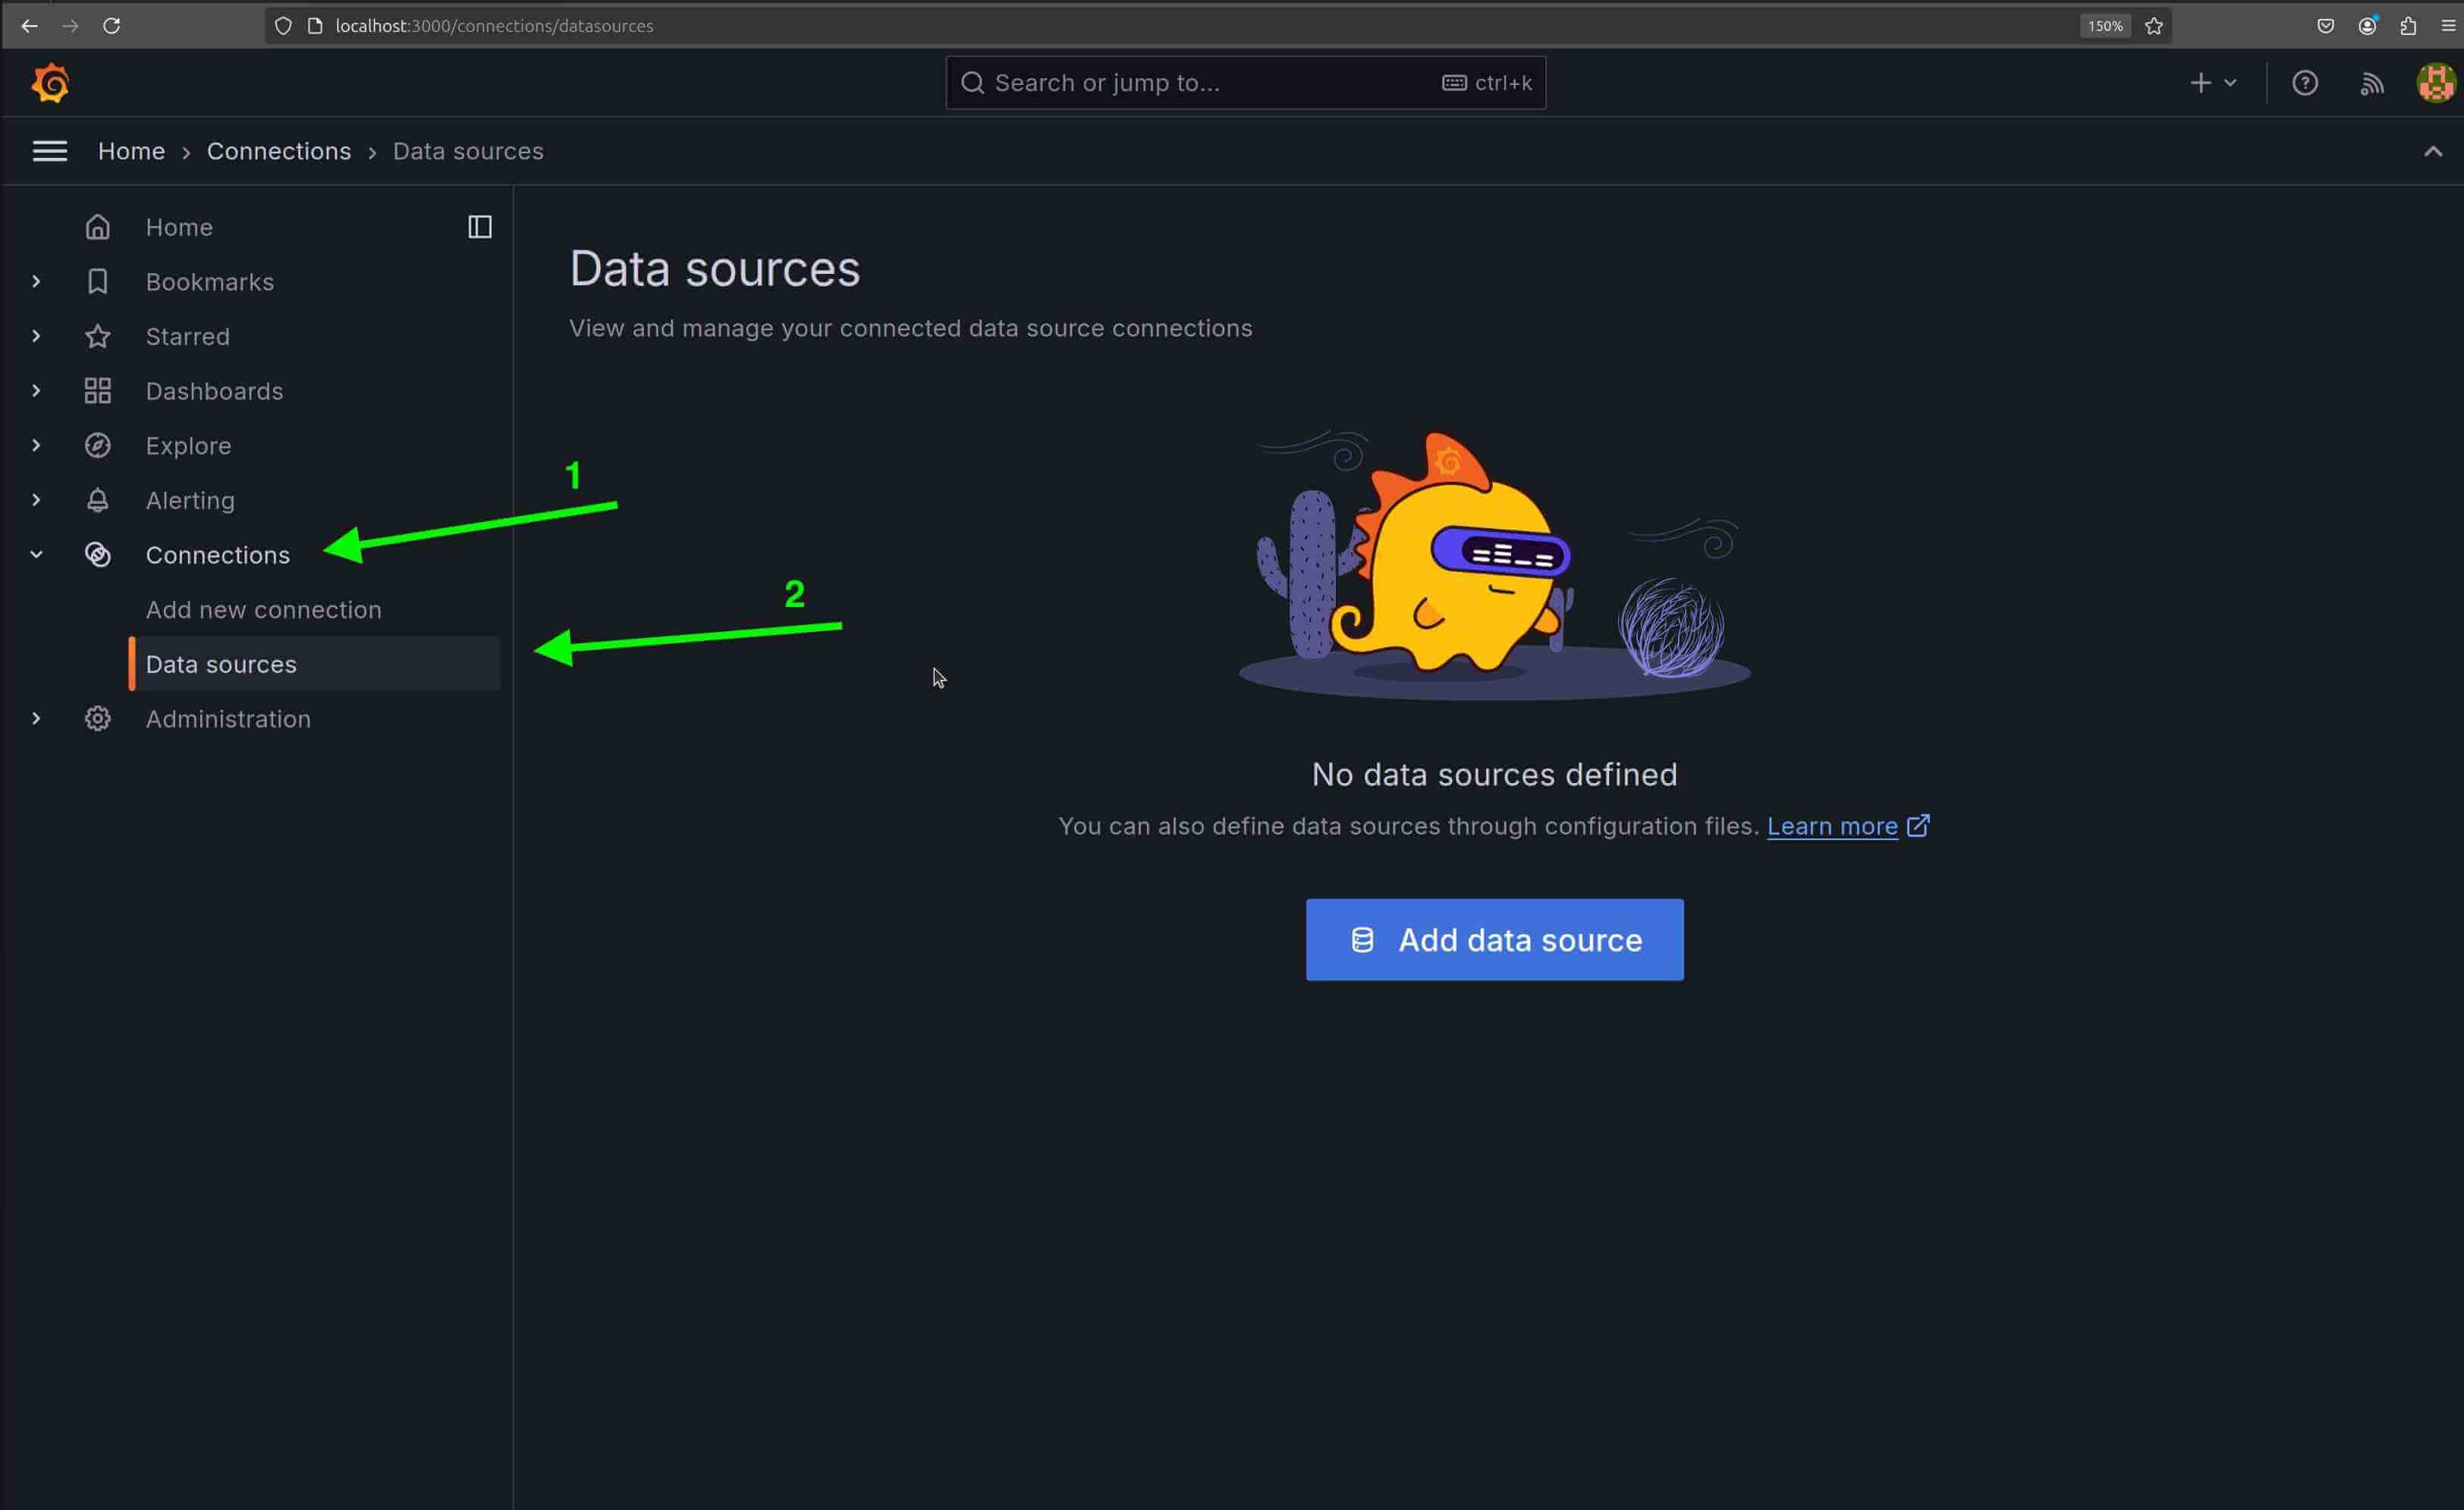
Go to data sources:
In the left sidebar, click to expand Connections then select Data sources. It will open the data sources management page, where you can add, view, and configure various data sources.

-
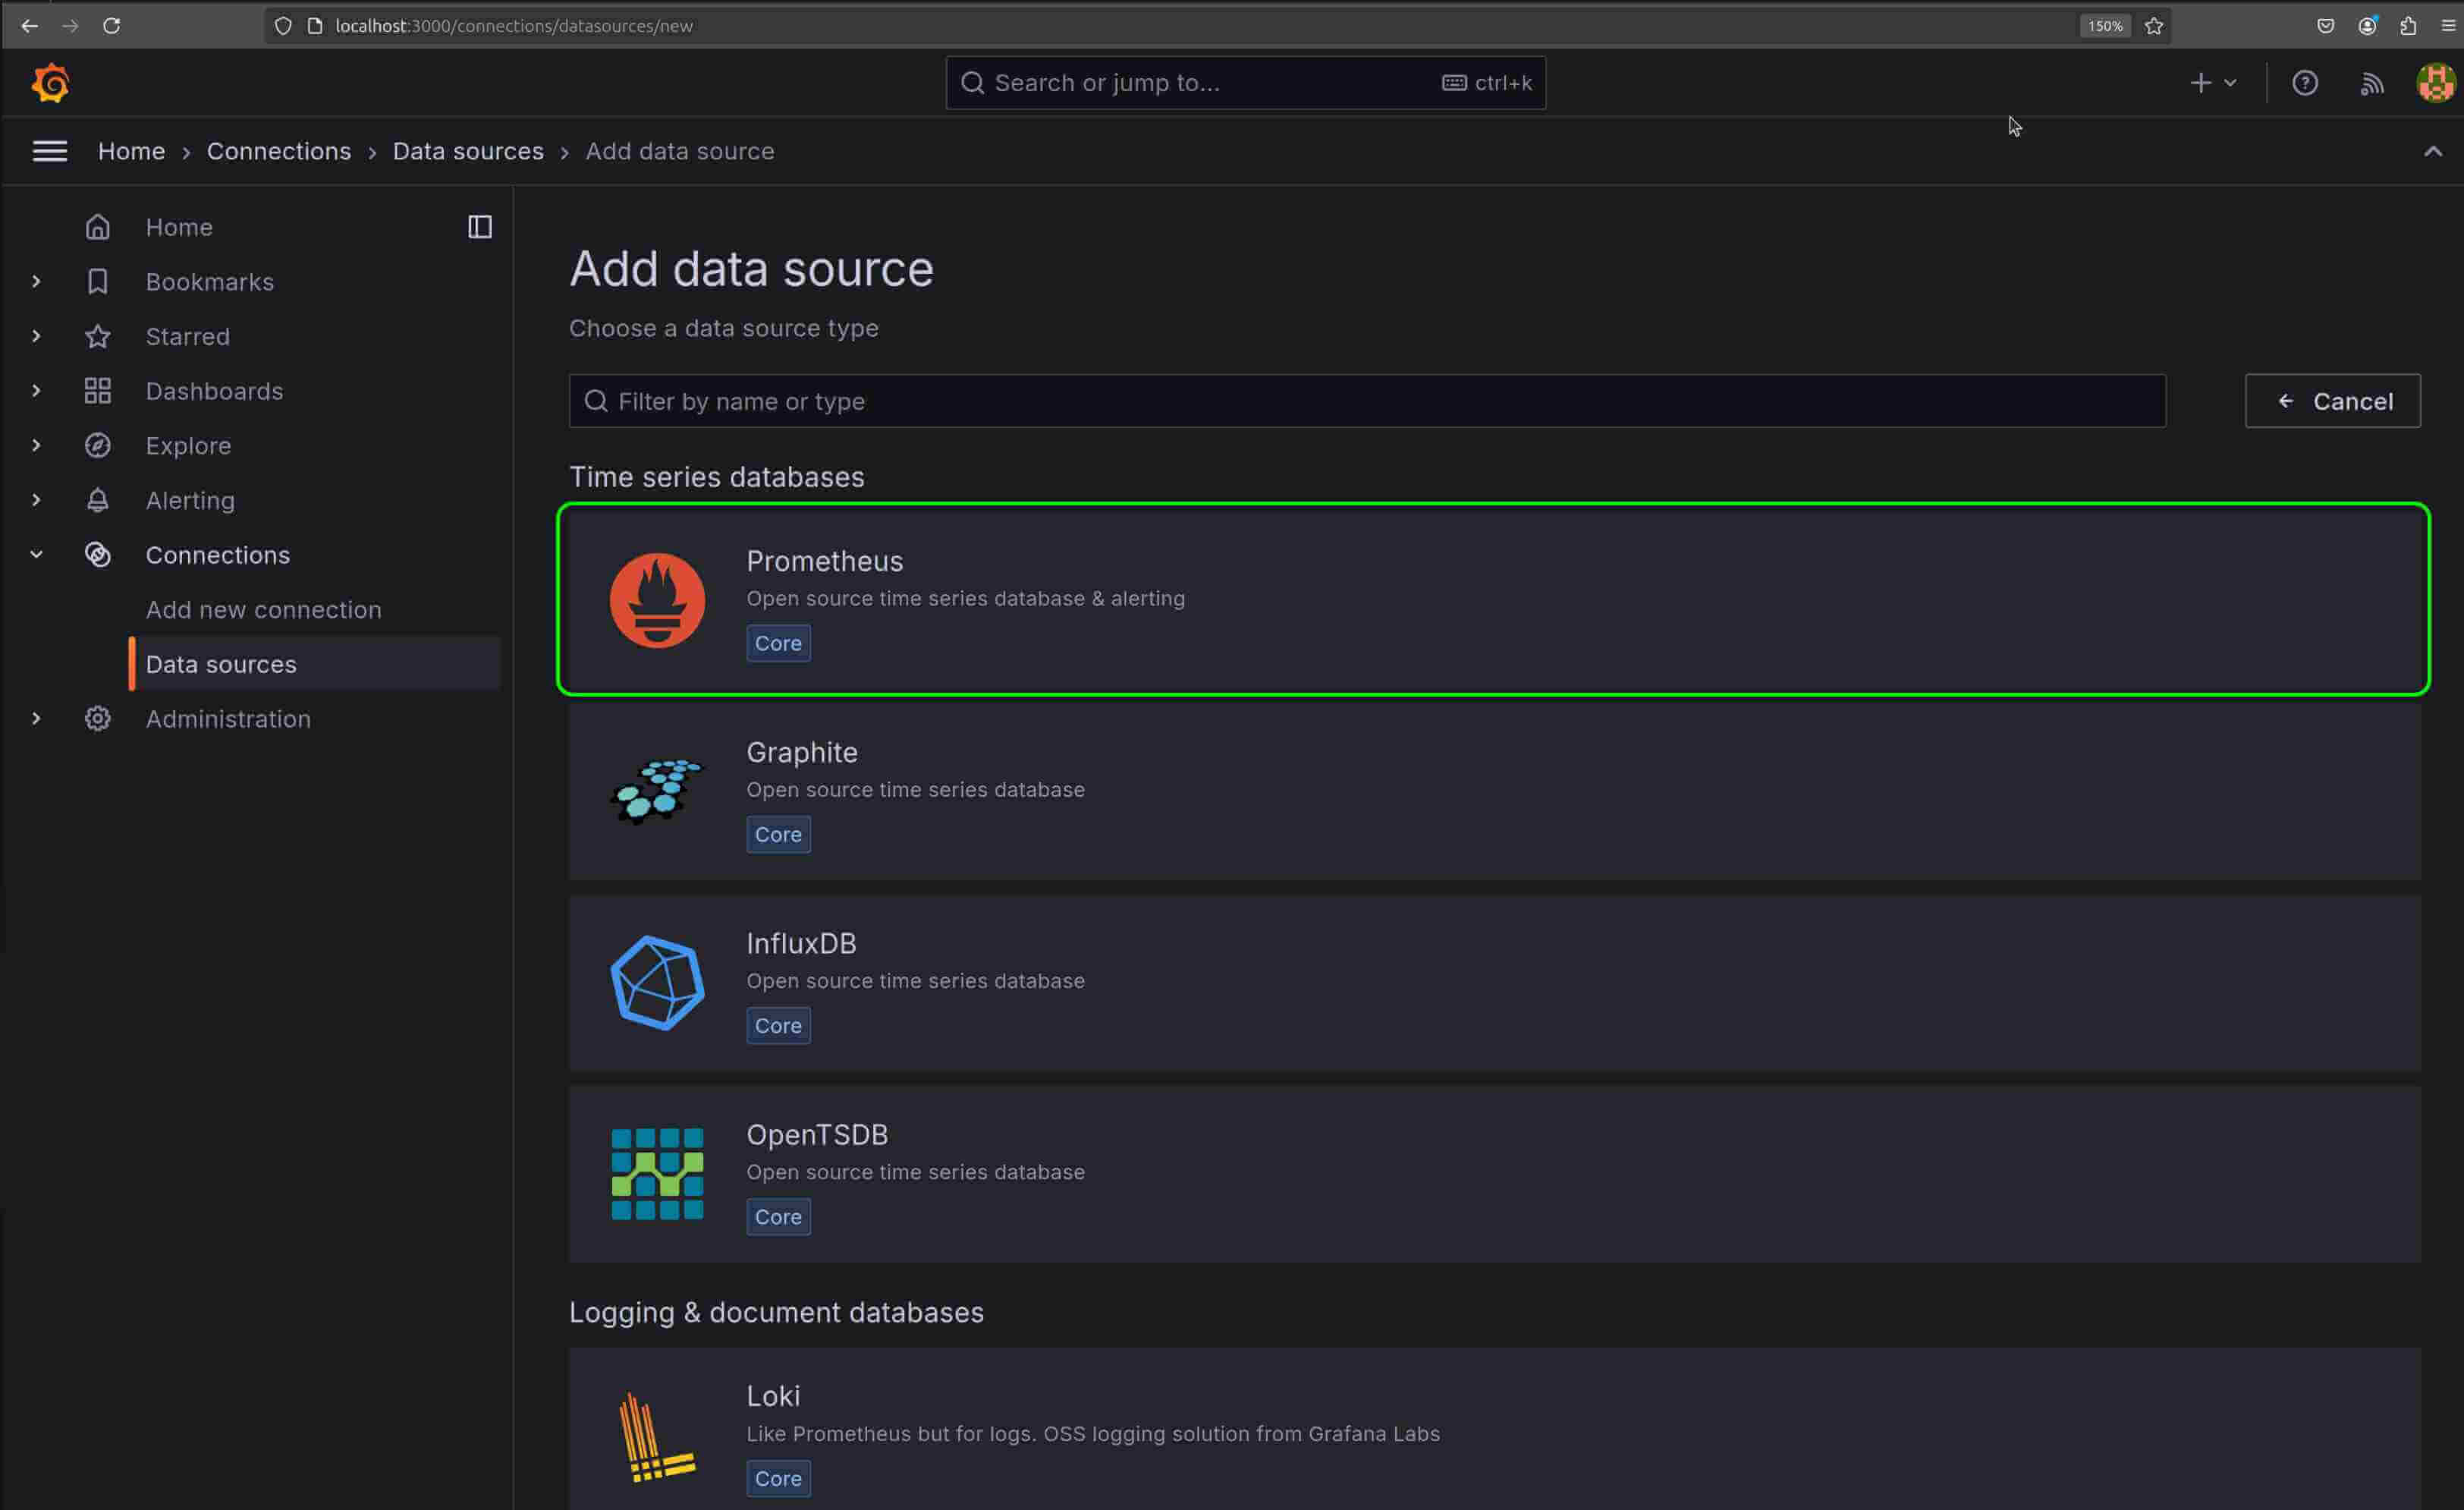
Add Prometheus as a data source:
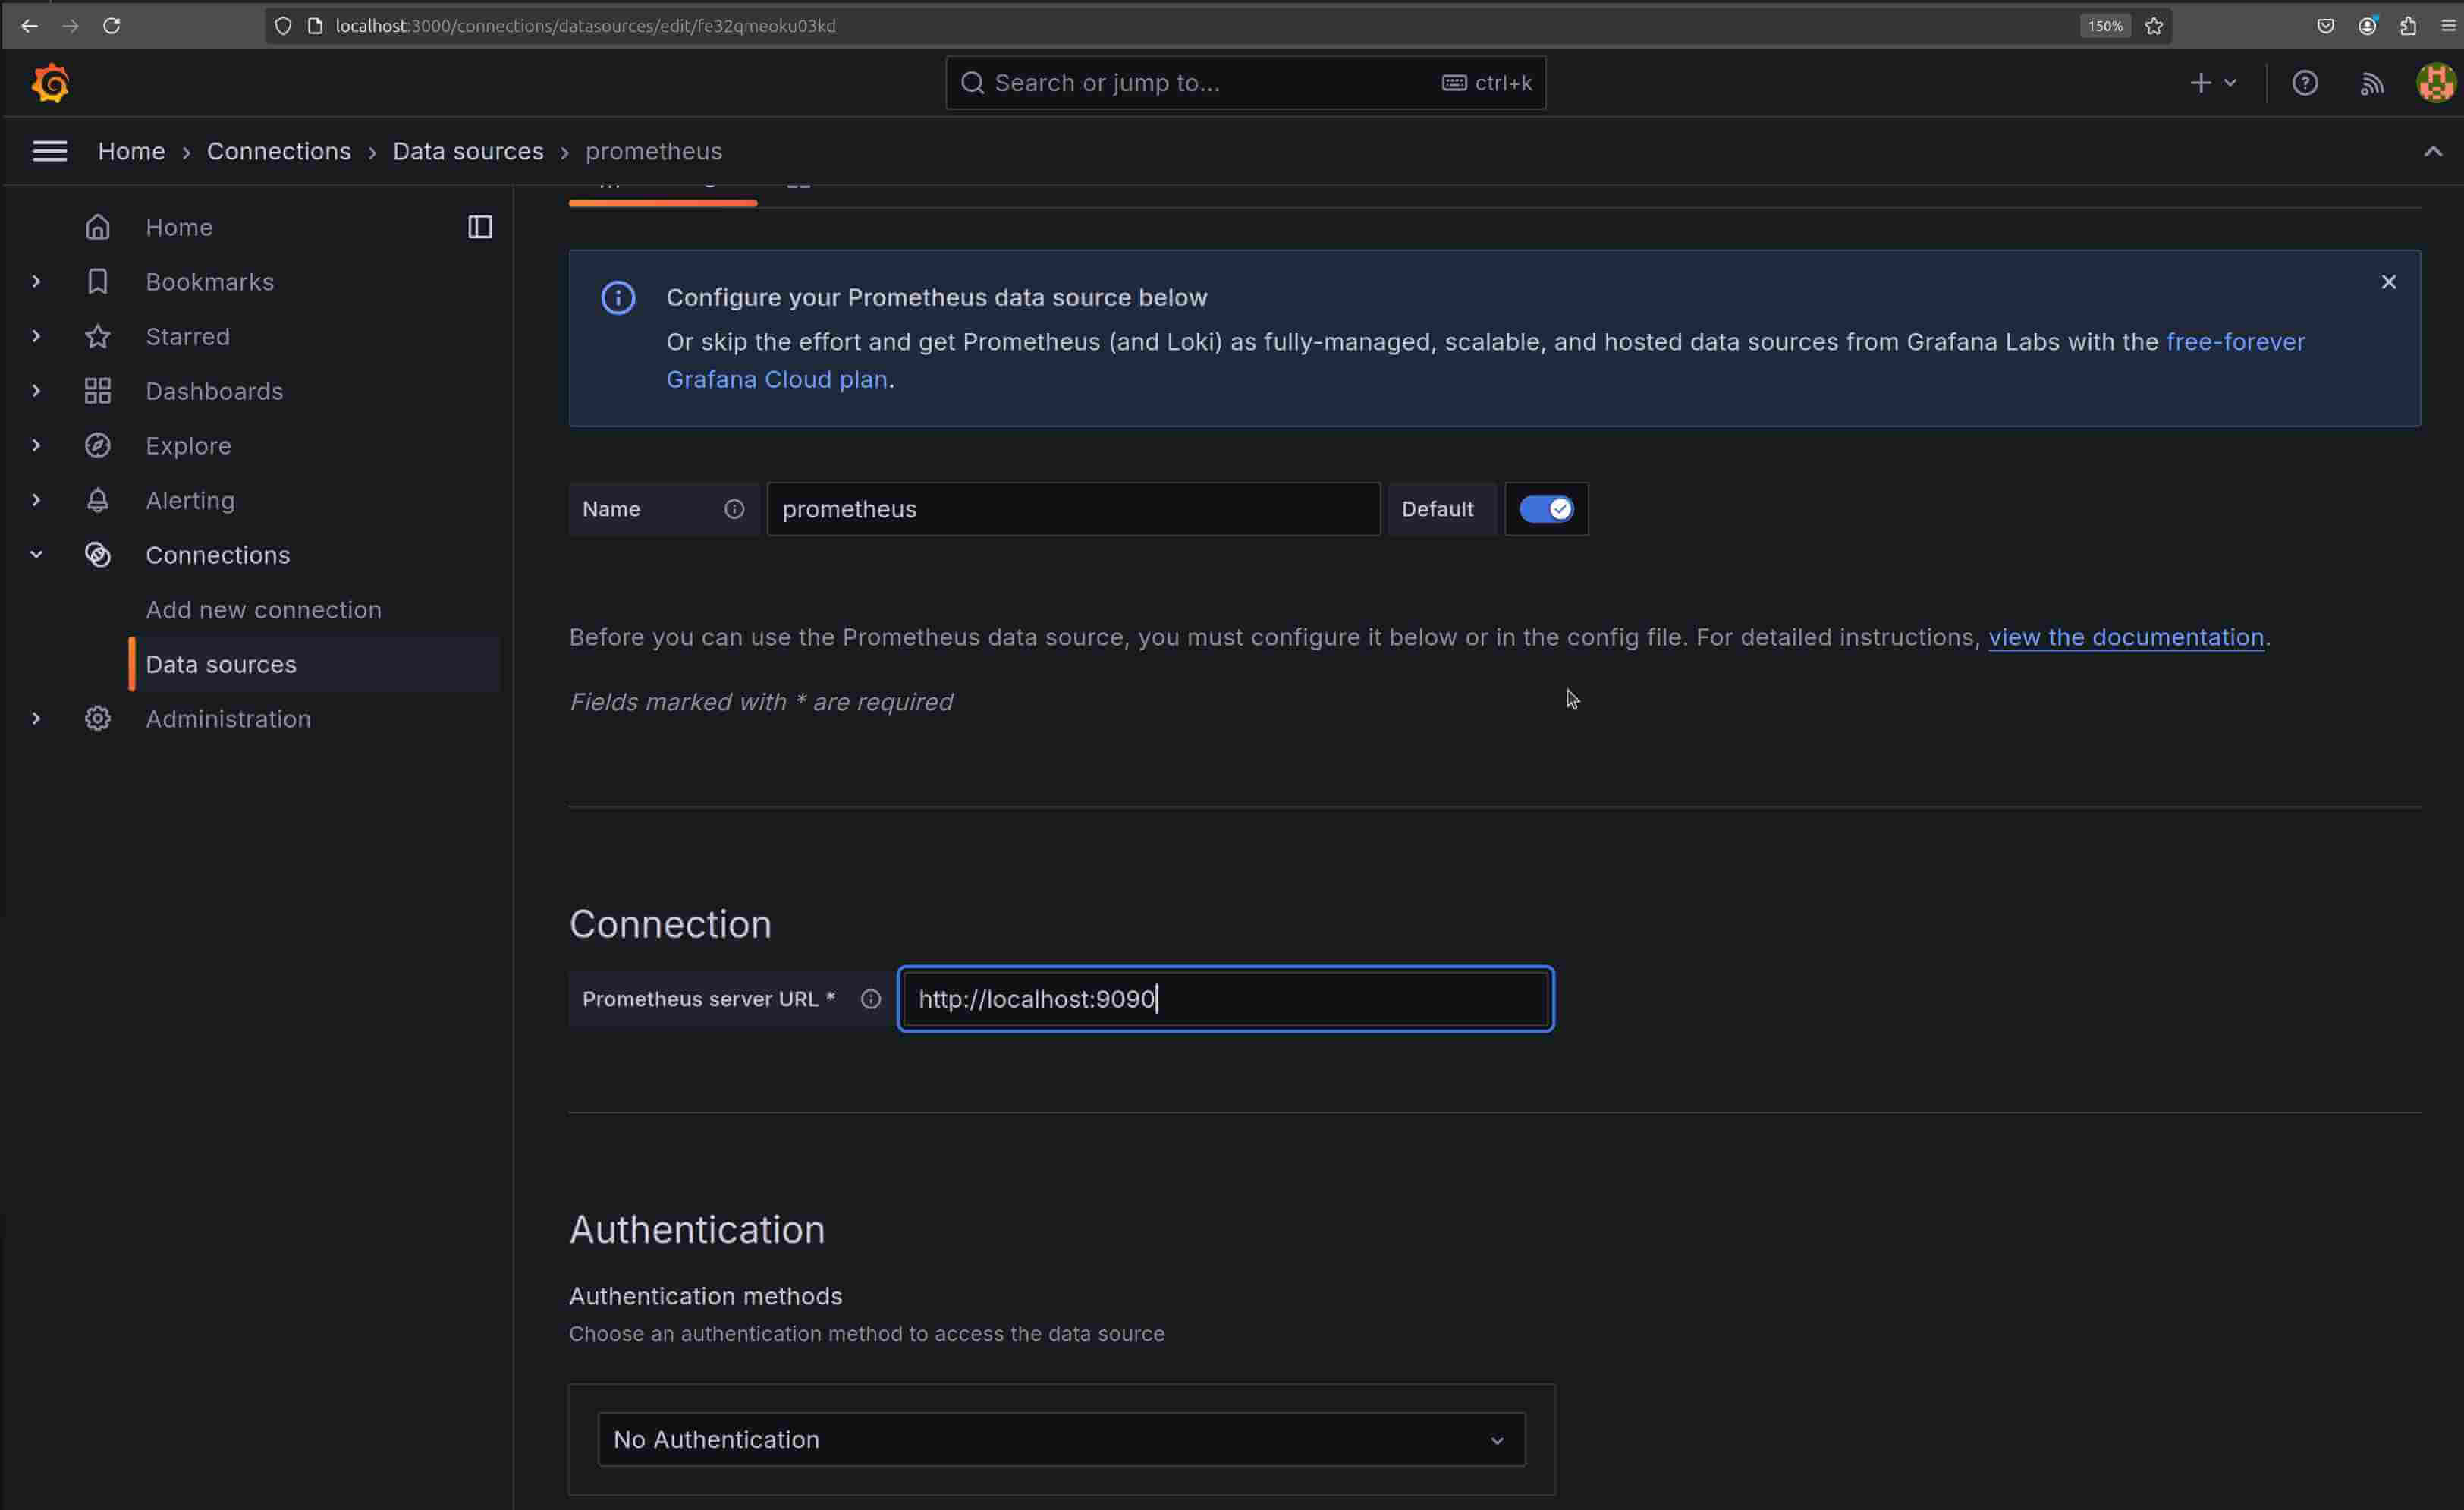
Click the Add data source button, then select Prometheus from the list of available data source types. This brings up the Prometheus configuration page:

-
Configure the Prometheus connection:
In the HTTP section, enter the URL for your Prometheus instance:
http://localhost:9090
The above URL assumes Prometheus is running on the same server as Grafana, as configured earlier in this tutorial.
Leave other settings as default unless you have specific requirements for authentication or custom headers.
Note: If Prometheus runs on a different server, replace
localhostwith your server’s IP address to connect remotely.
-
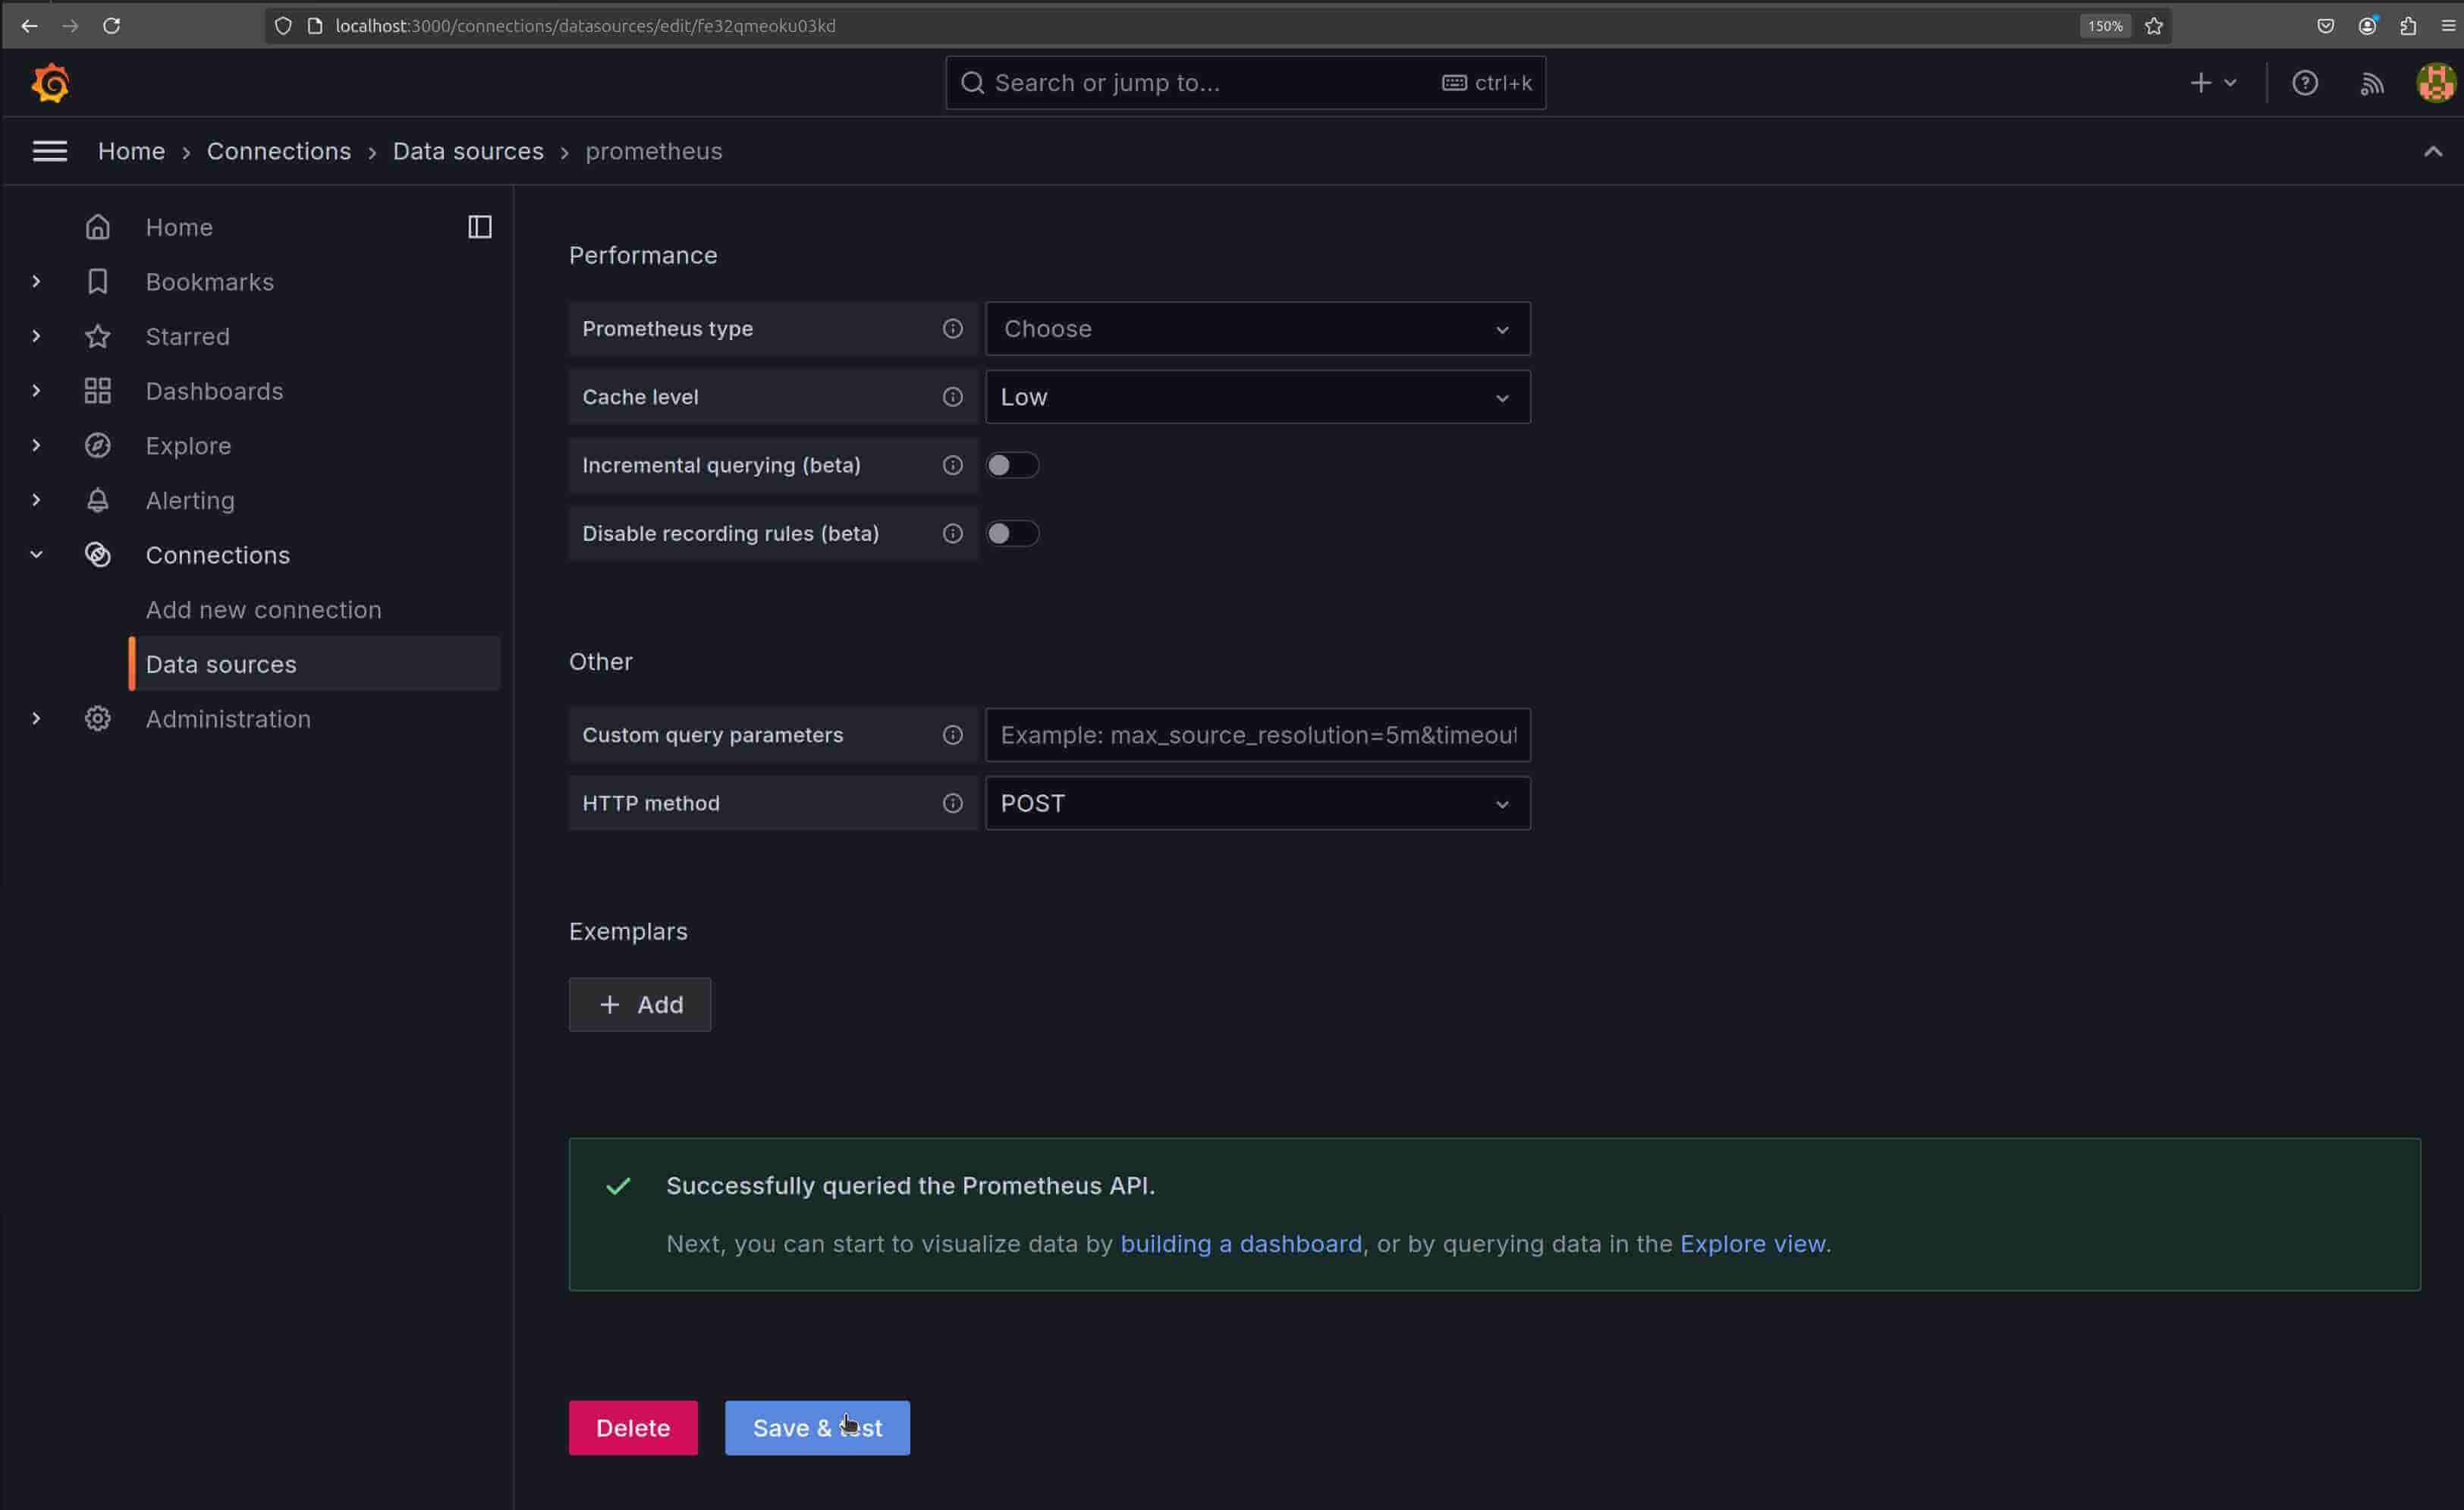
Test the connection:
Click on the Save & test button. Grafana will attempt to connect to Prometheus and display a success message if the connection is successful.
 If the connection fails, ensure that:
- Prometheus is running on the specified URL.
- the firewall allows traffic on Prometheus’s port (9090).
- the URL is correct (verify with http://localhost:9090 or the server IP).
#Building dashboards and visualizing metrics
This section will walk you through creating dashboards.
#Creating dashboards
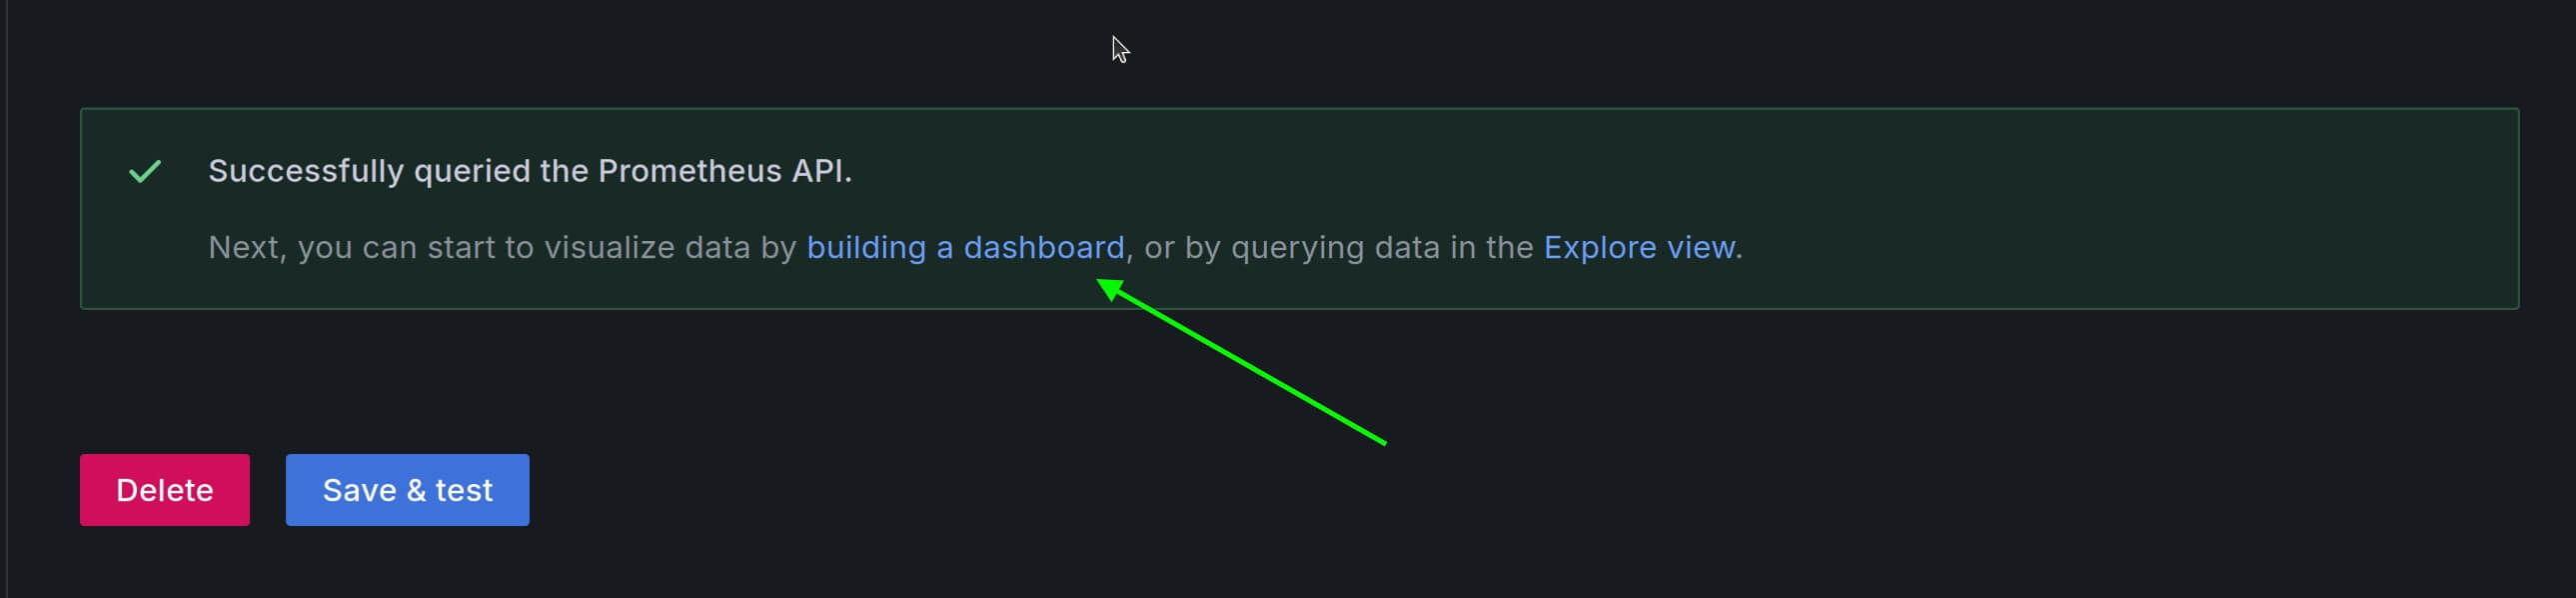
Grafana provides a link to build a dashboard immediately after you save and test your Prometheus data source. Follow these steps to create a dashboard:
-
Click on the building a dashboard link as shown below:
 This will take you directly to the dashboard creation page.
 -
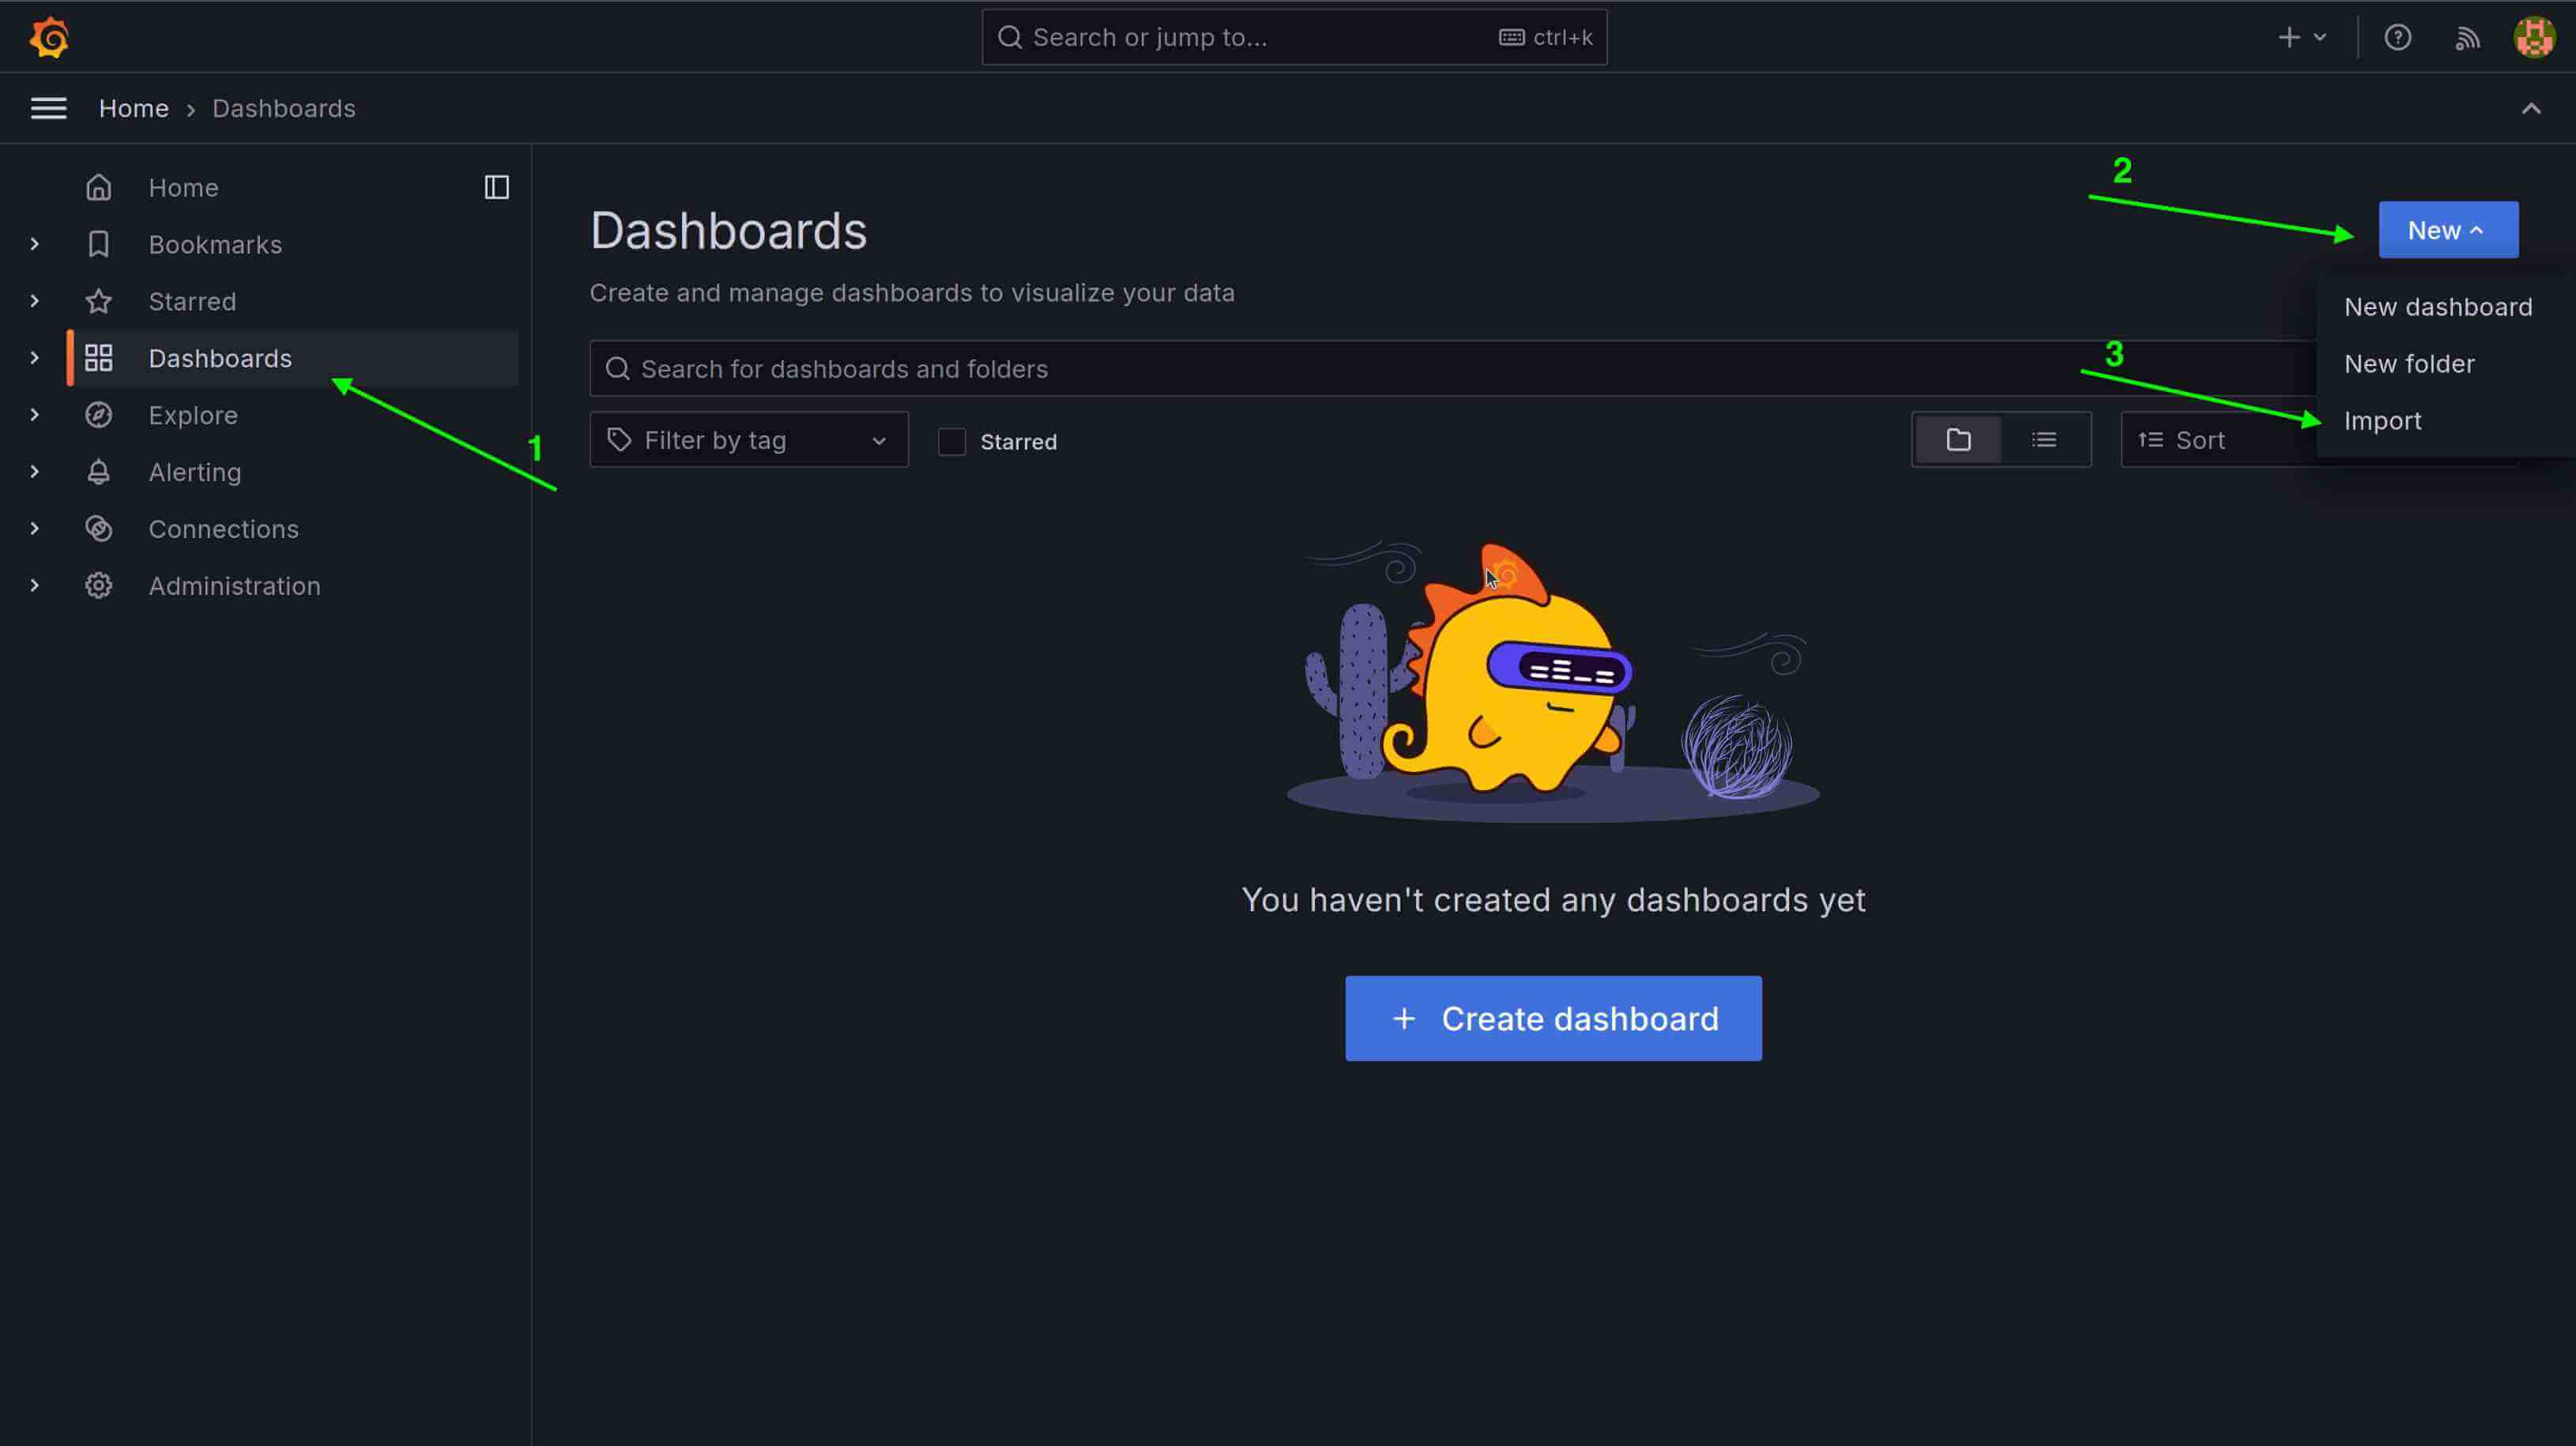
On the dashboard creation page, click the New dropdown button in the right corner and select the Import option:
This will take you to the Import Dashboard page. -
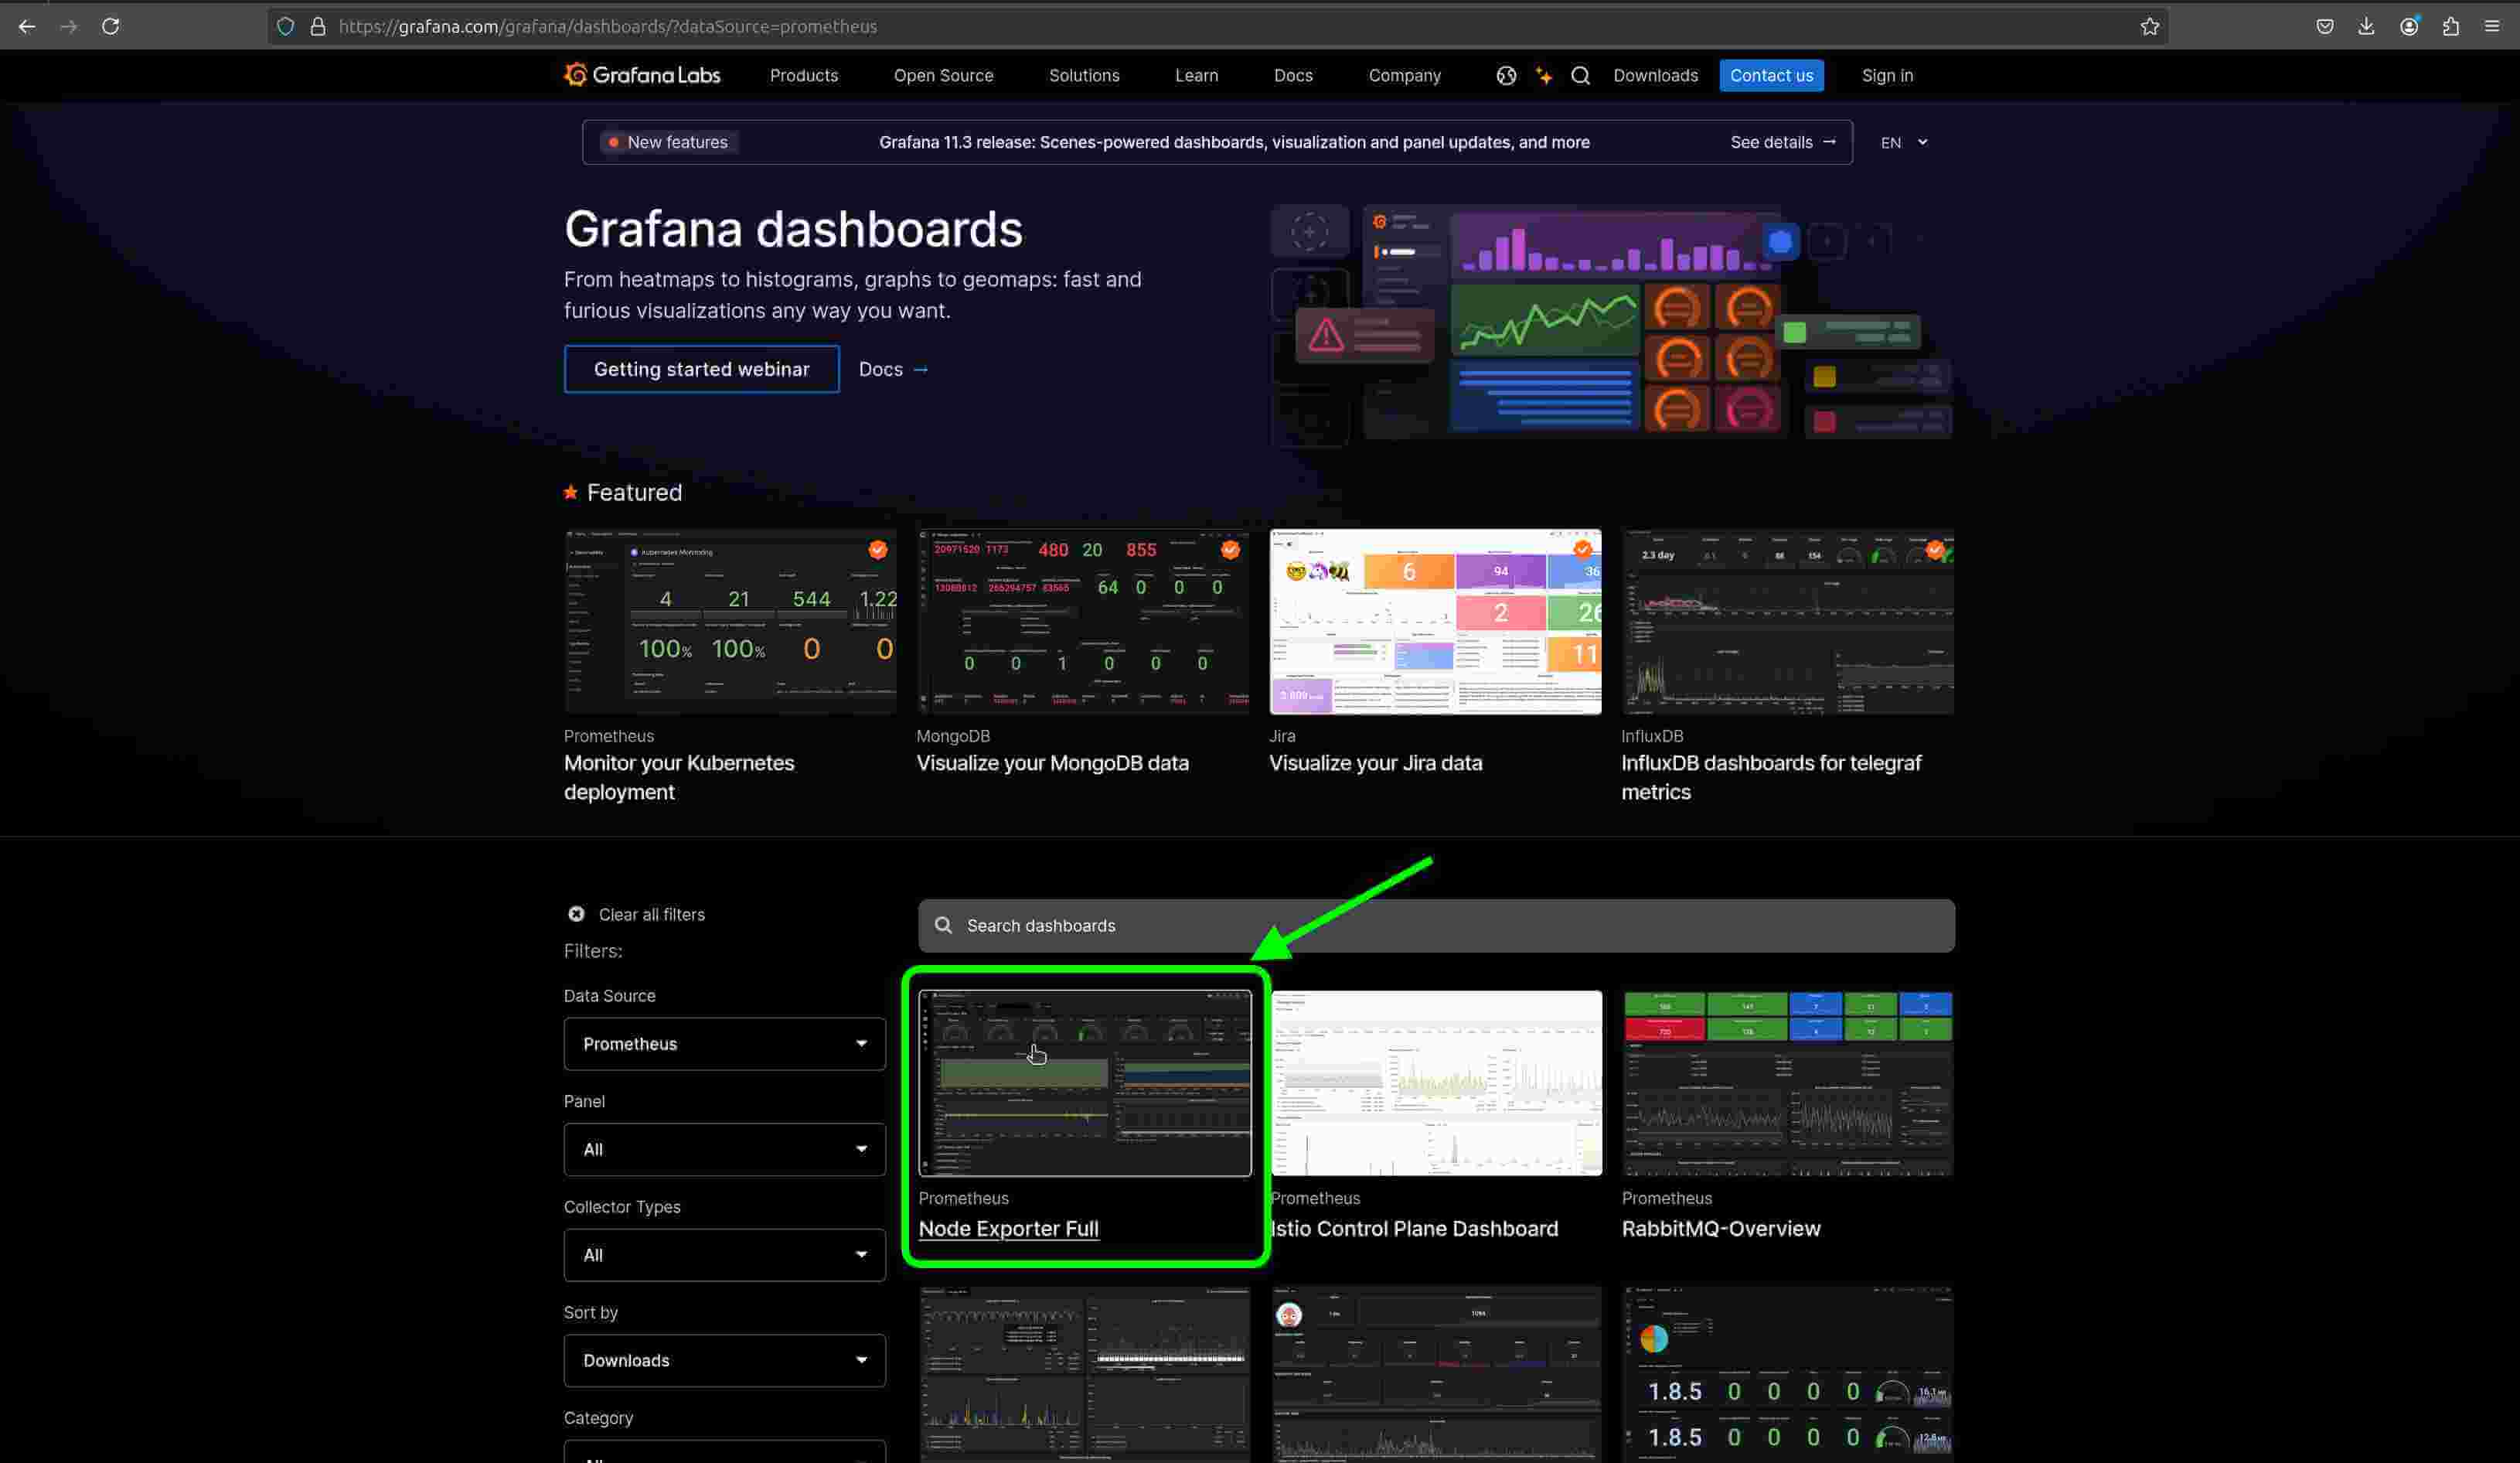
Head to Grafana dashboards and click on the Node Exporter Full dashboard:
 This will take you to the Node Exporter Full dashboard page.
 -
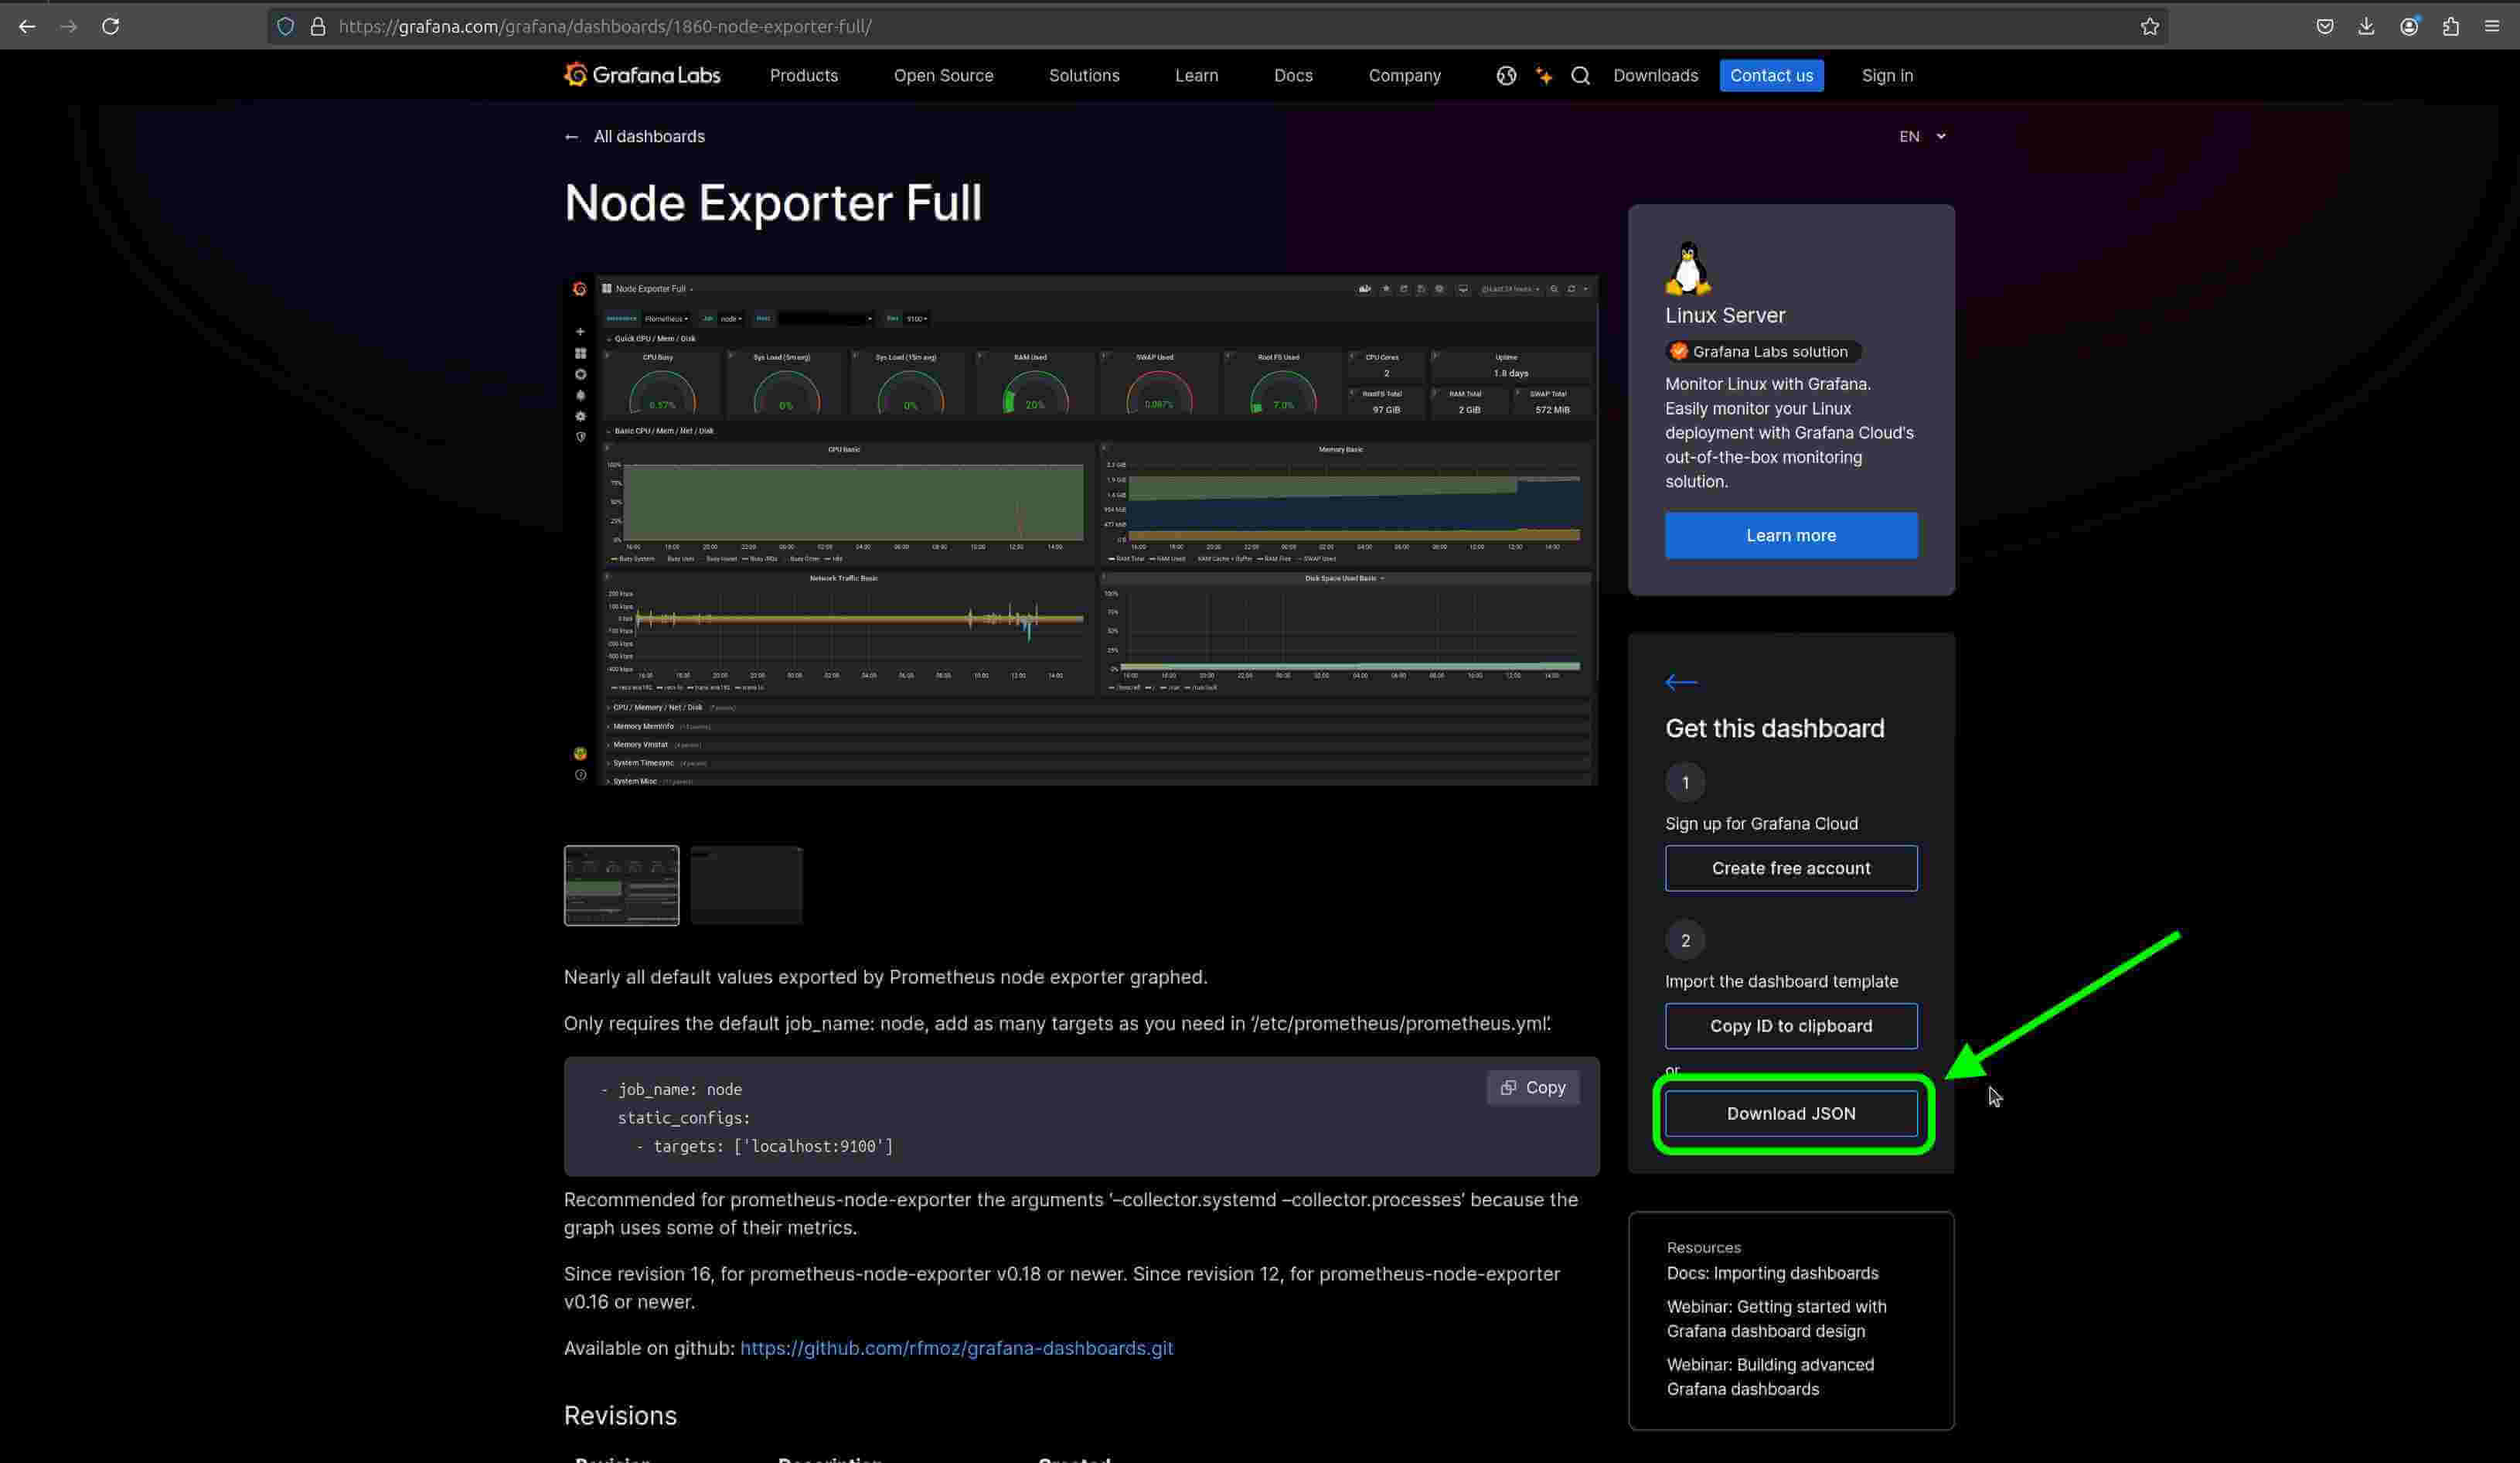
Click the Download JSON button to download the dashboard

-
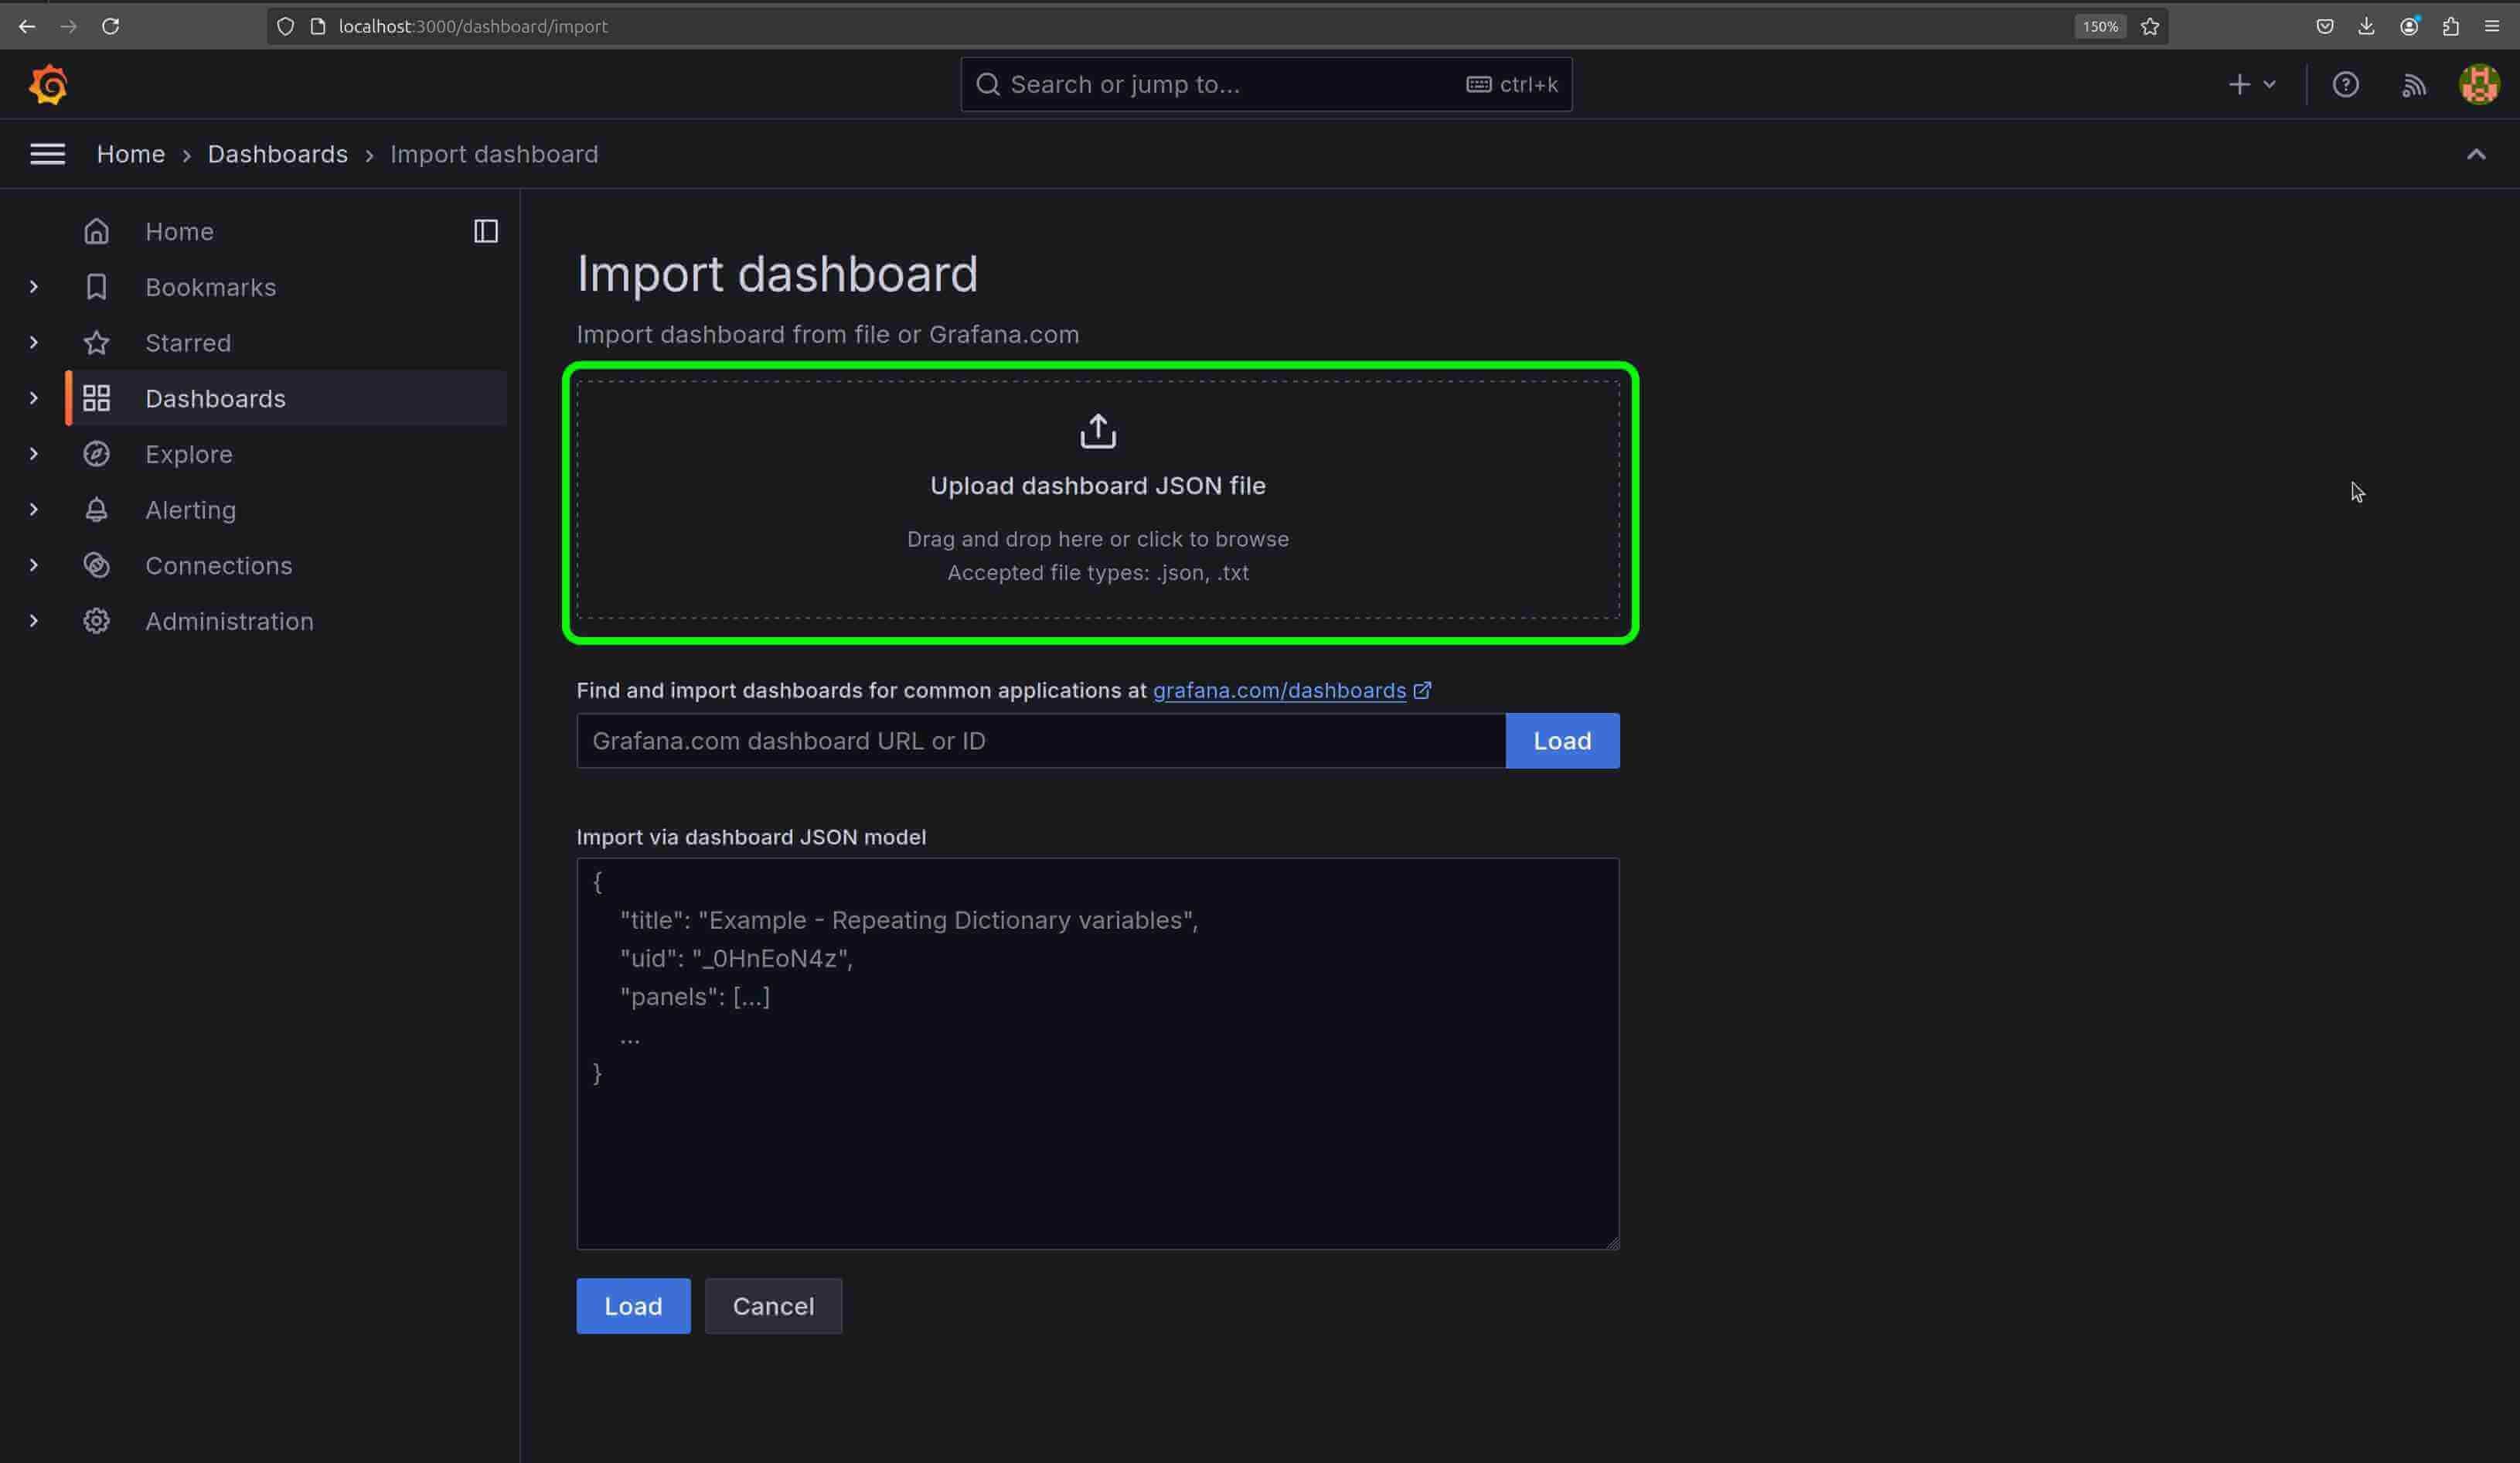
Head back to the Grafana Import Dashboard page and upload the Node Exporter Dashboard you downloaded:
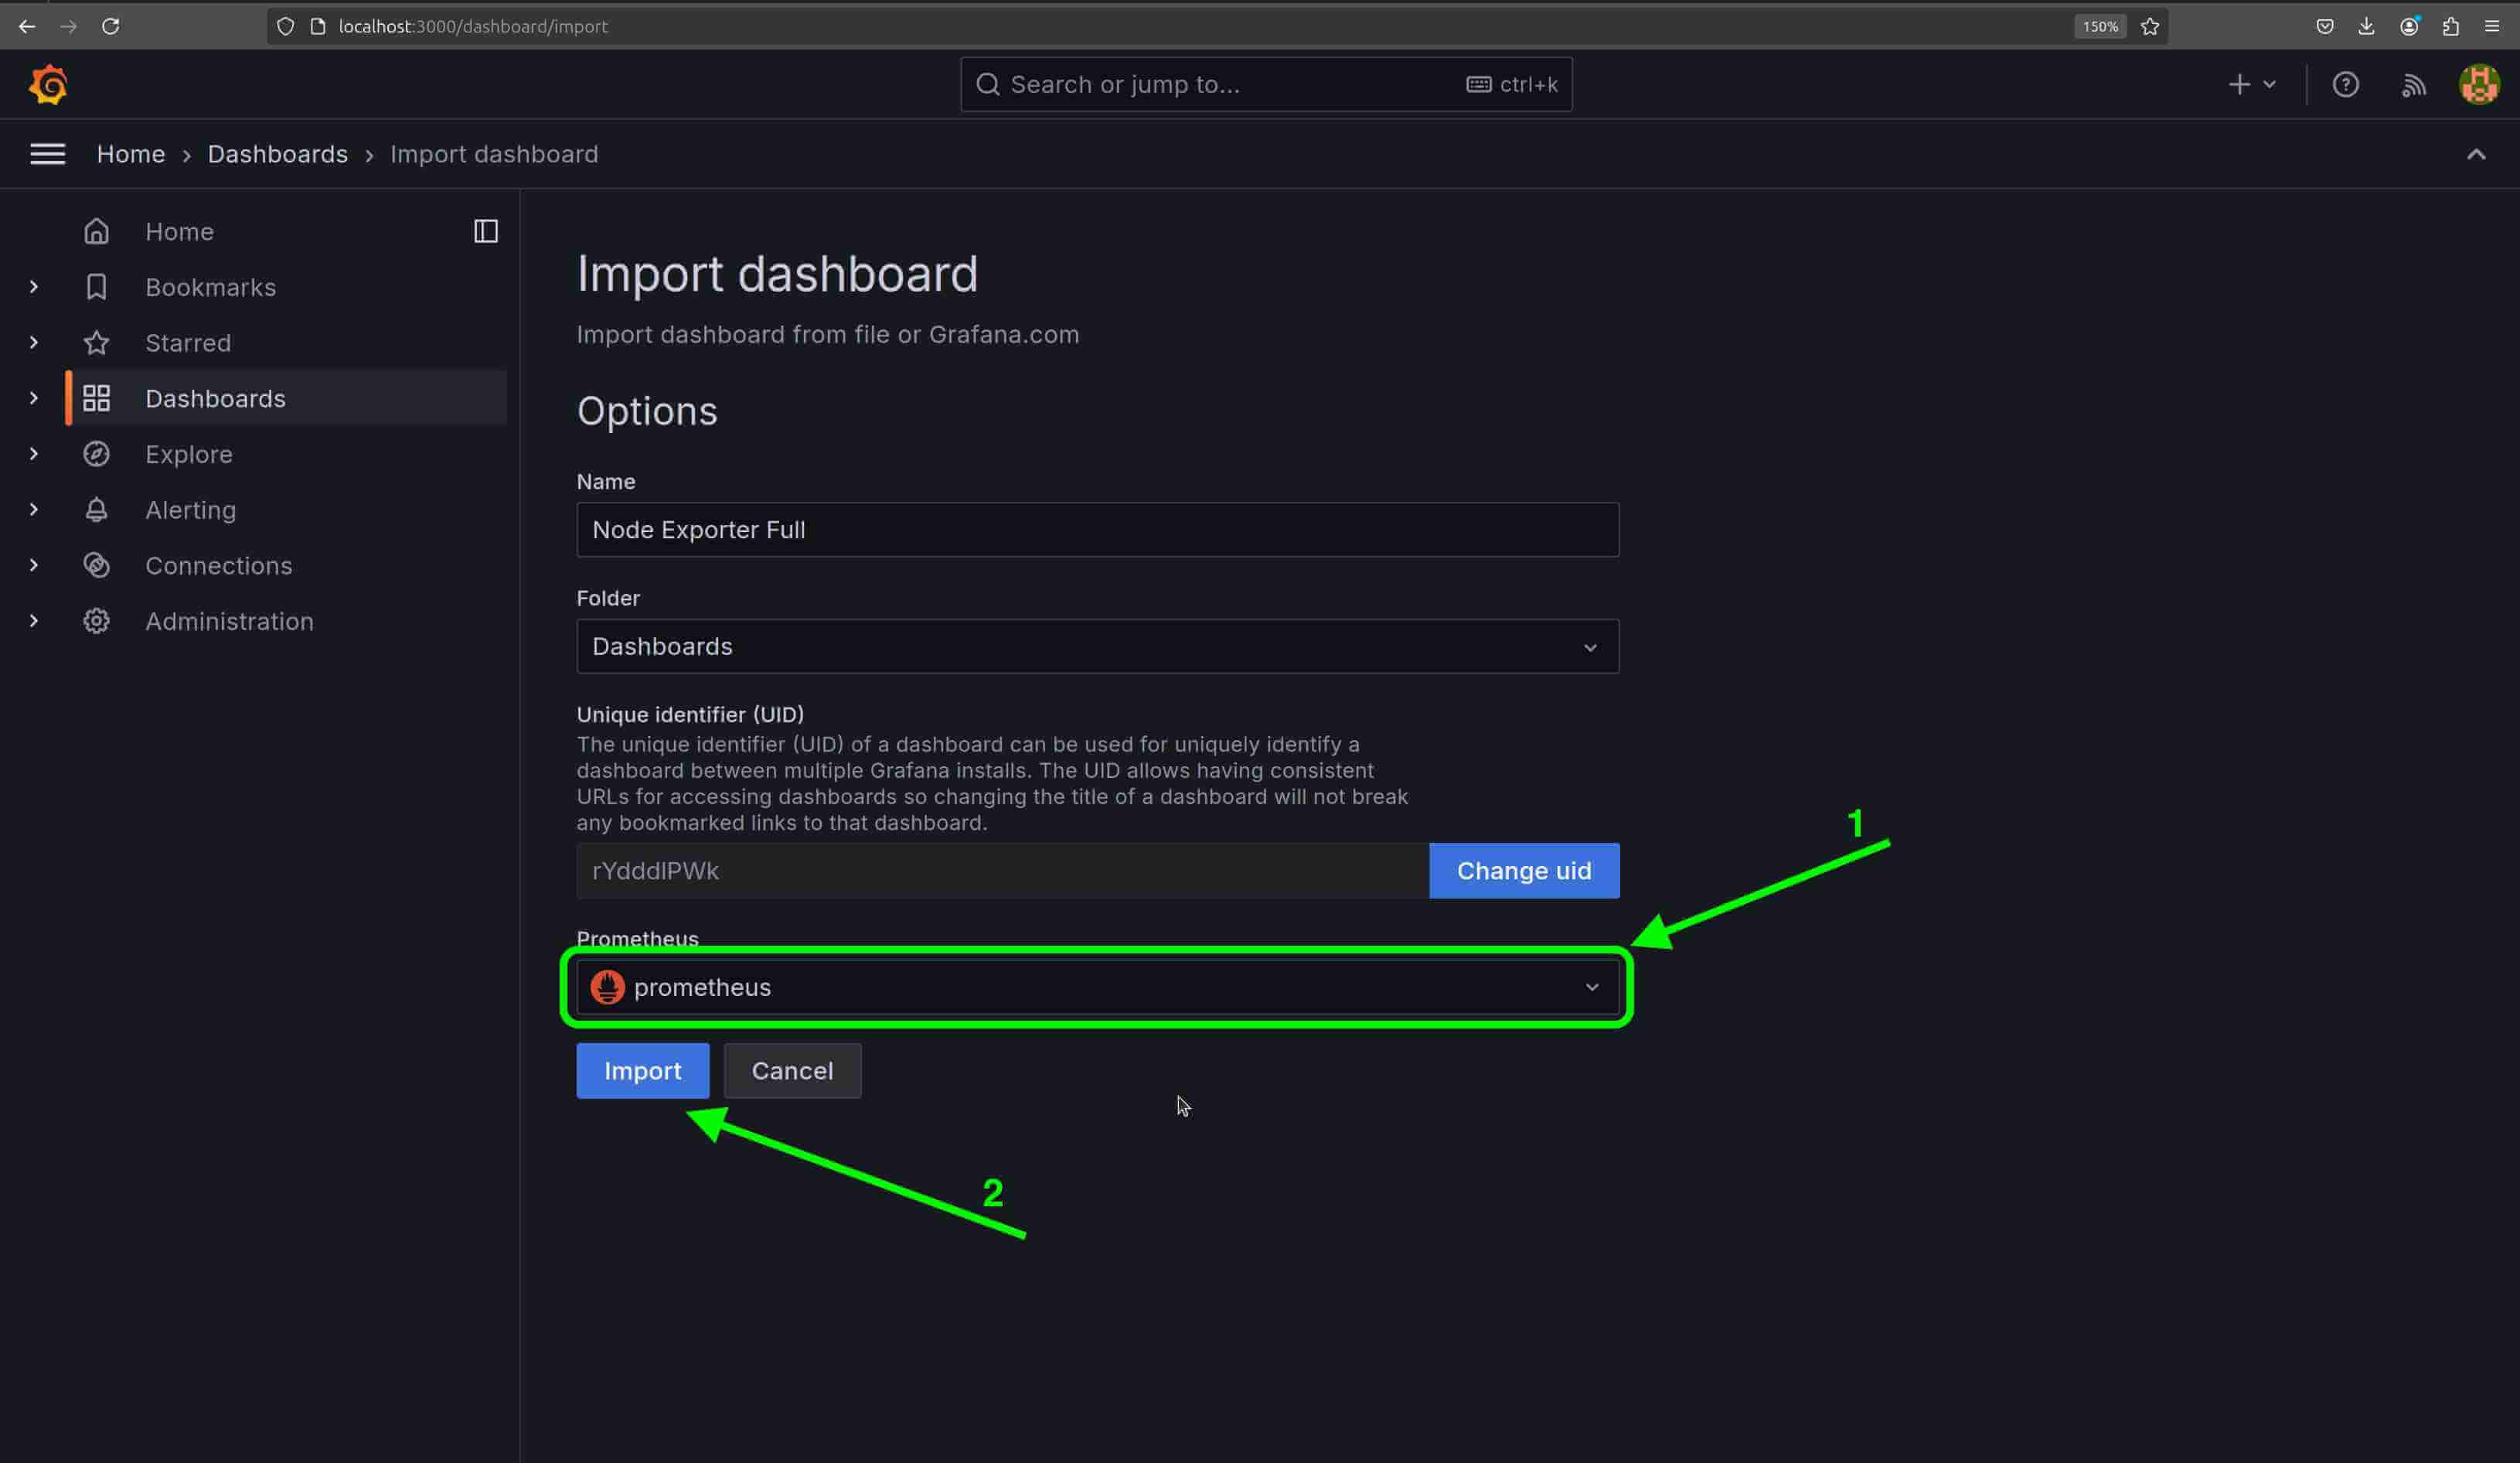
 Then, select Prometheus as a data source and click the Import button:

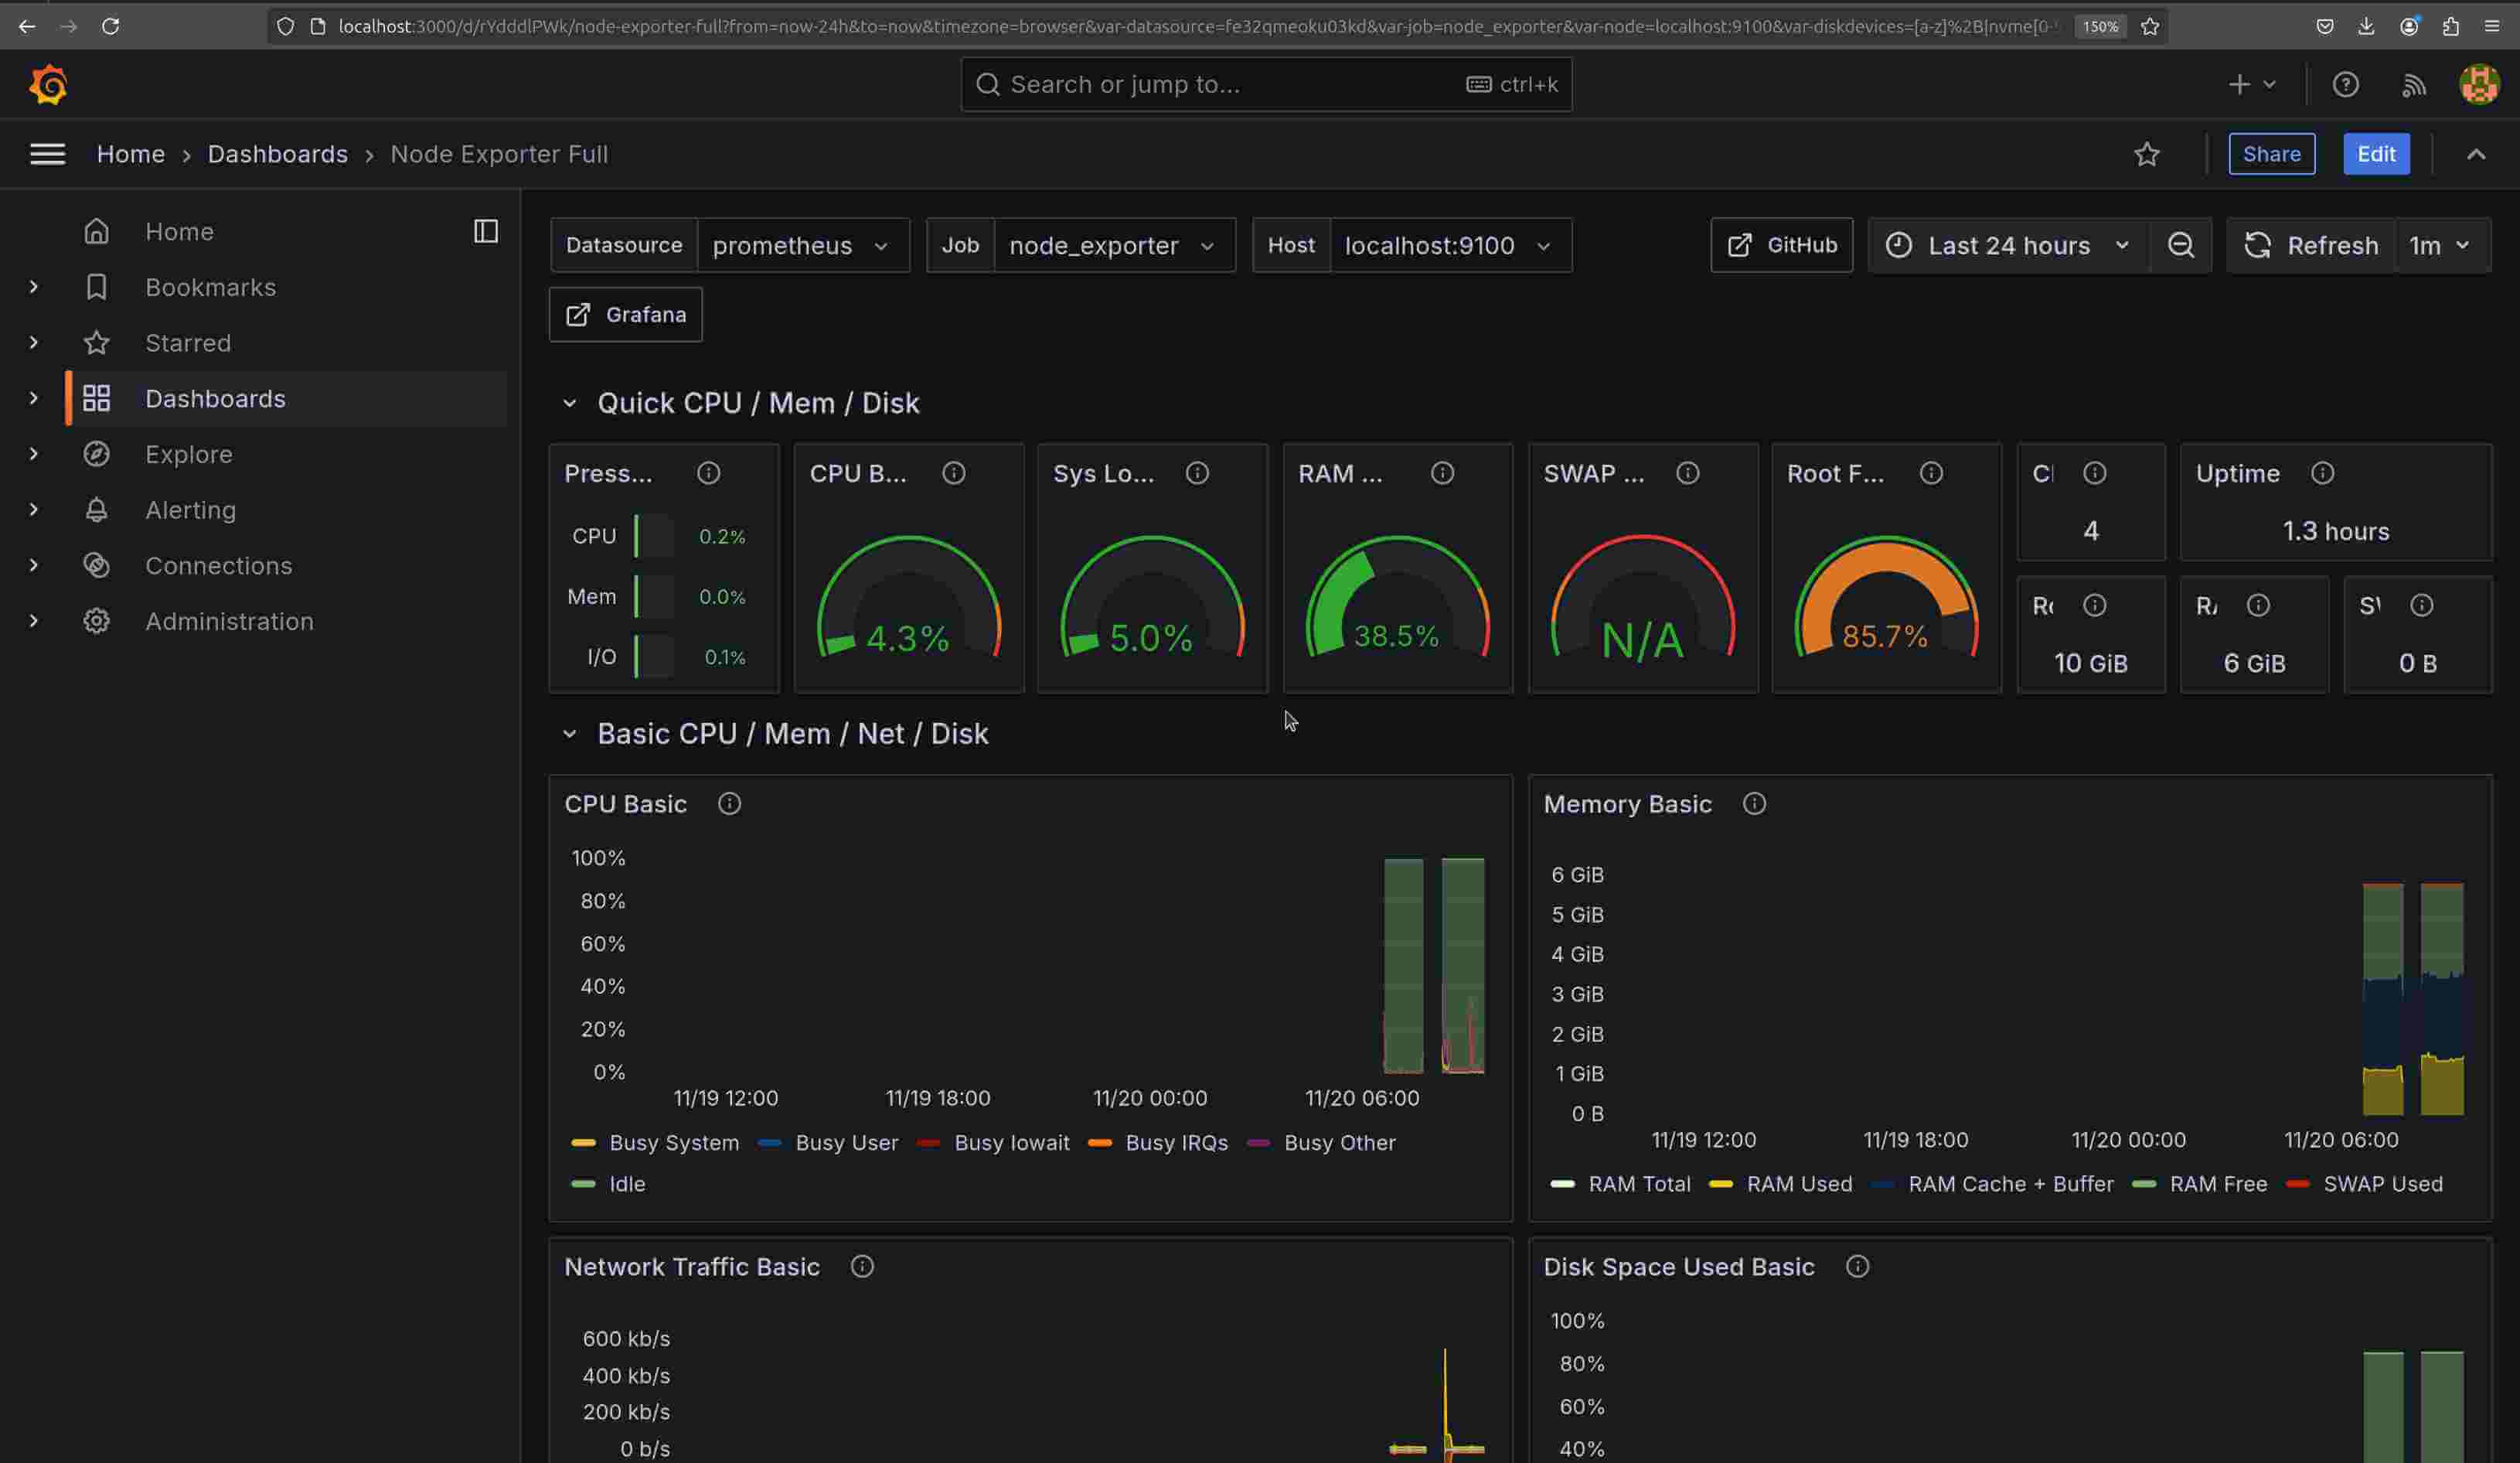
You should see a dashboard similar to this:
#Setting up alerts
Setting up alerts in Prometheus and Grafana allows you to stay updated when metrics exceed specified thresholds. In this section, you’ll configure basic alerts in both Prometheus and Grafana.
#Configuring alerts in Prometheus
Alerts in Prometheus are set up by defining alerting rules, which specify conditions that trigger an alert. These rules are written in PromQL and stored in a separate file.
-
Create the
alert.rules.ymlfile:Navigate to the Prometheus configuration directory, usually located at
/etc/prometheus/:cd /etc/prometheus/Create and open the
alert.rules.ymlfile using a text editor:sudo nano alert.rules.yml -
Define an alerting rule: For example, in
alert.rules.ymladd a rule to trigger an alert when CPU usage exceeds 80% for more than 5 minutes:groups: - name: example_alert_rules rules: - alert: HighCPUUsage expr: 100 - (avg by(instance) (rate(node_cpu_seconds_total{mode="idle"}[5m])) \* 100) > 80 for: 5m labels: severity: warning annotations: summary: "High CPU usage detected" description: "CPU usage is above 80% on "The above configuration defines an alert called HighCPUUsage, which triggers if CPU usage remains above 80% for over 5 minutes.
-
Add
alert.rules.ymlto Prometheus configuration:Open the main Prometheus configuration file,
prometheus.yml:sudo nano prometheus.ymlUnder the
rules_filessection, include the new alert rules file:rule_files: - "alert.rules.yml" -
Restart Prometheus:
To apply the new alert rules, you’ll need to restart Prometheus, as it doesn’t support reloading configuration via
systemctl. Use the following command to restart Prometheus and apply the changes:sudo systemctl restart prometheusNote: Restarting Prometheus may temporarily interrupt data collection, so it's best to do this during a maintenance window if possible.
#Configuring alerts in Grafana
In addition to Prometheus alerts, Grafana allows you to set up custom alerts based on your metrics. Grafana’s alerting feature can notify you via email, Slack, or other communication channels. Here’s how to set up alerts in Grafana using the updated interface:
-
Create an alert rule:
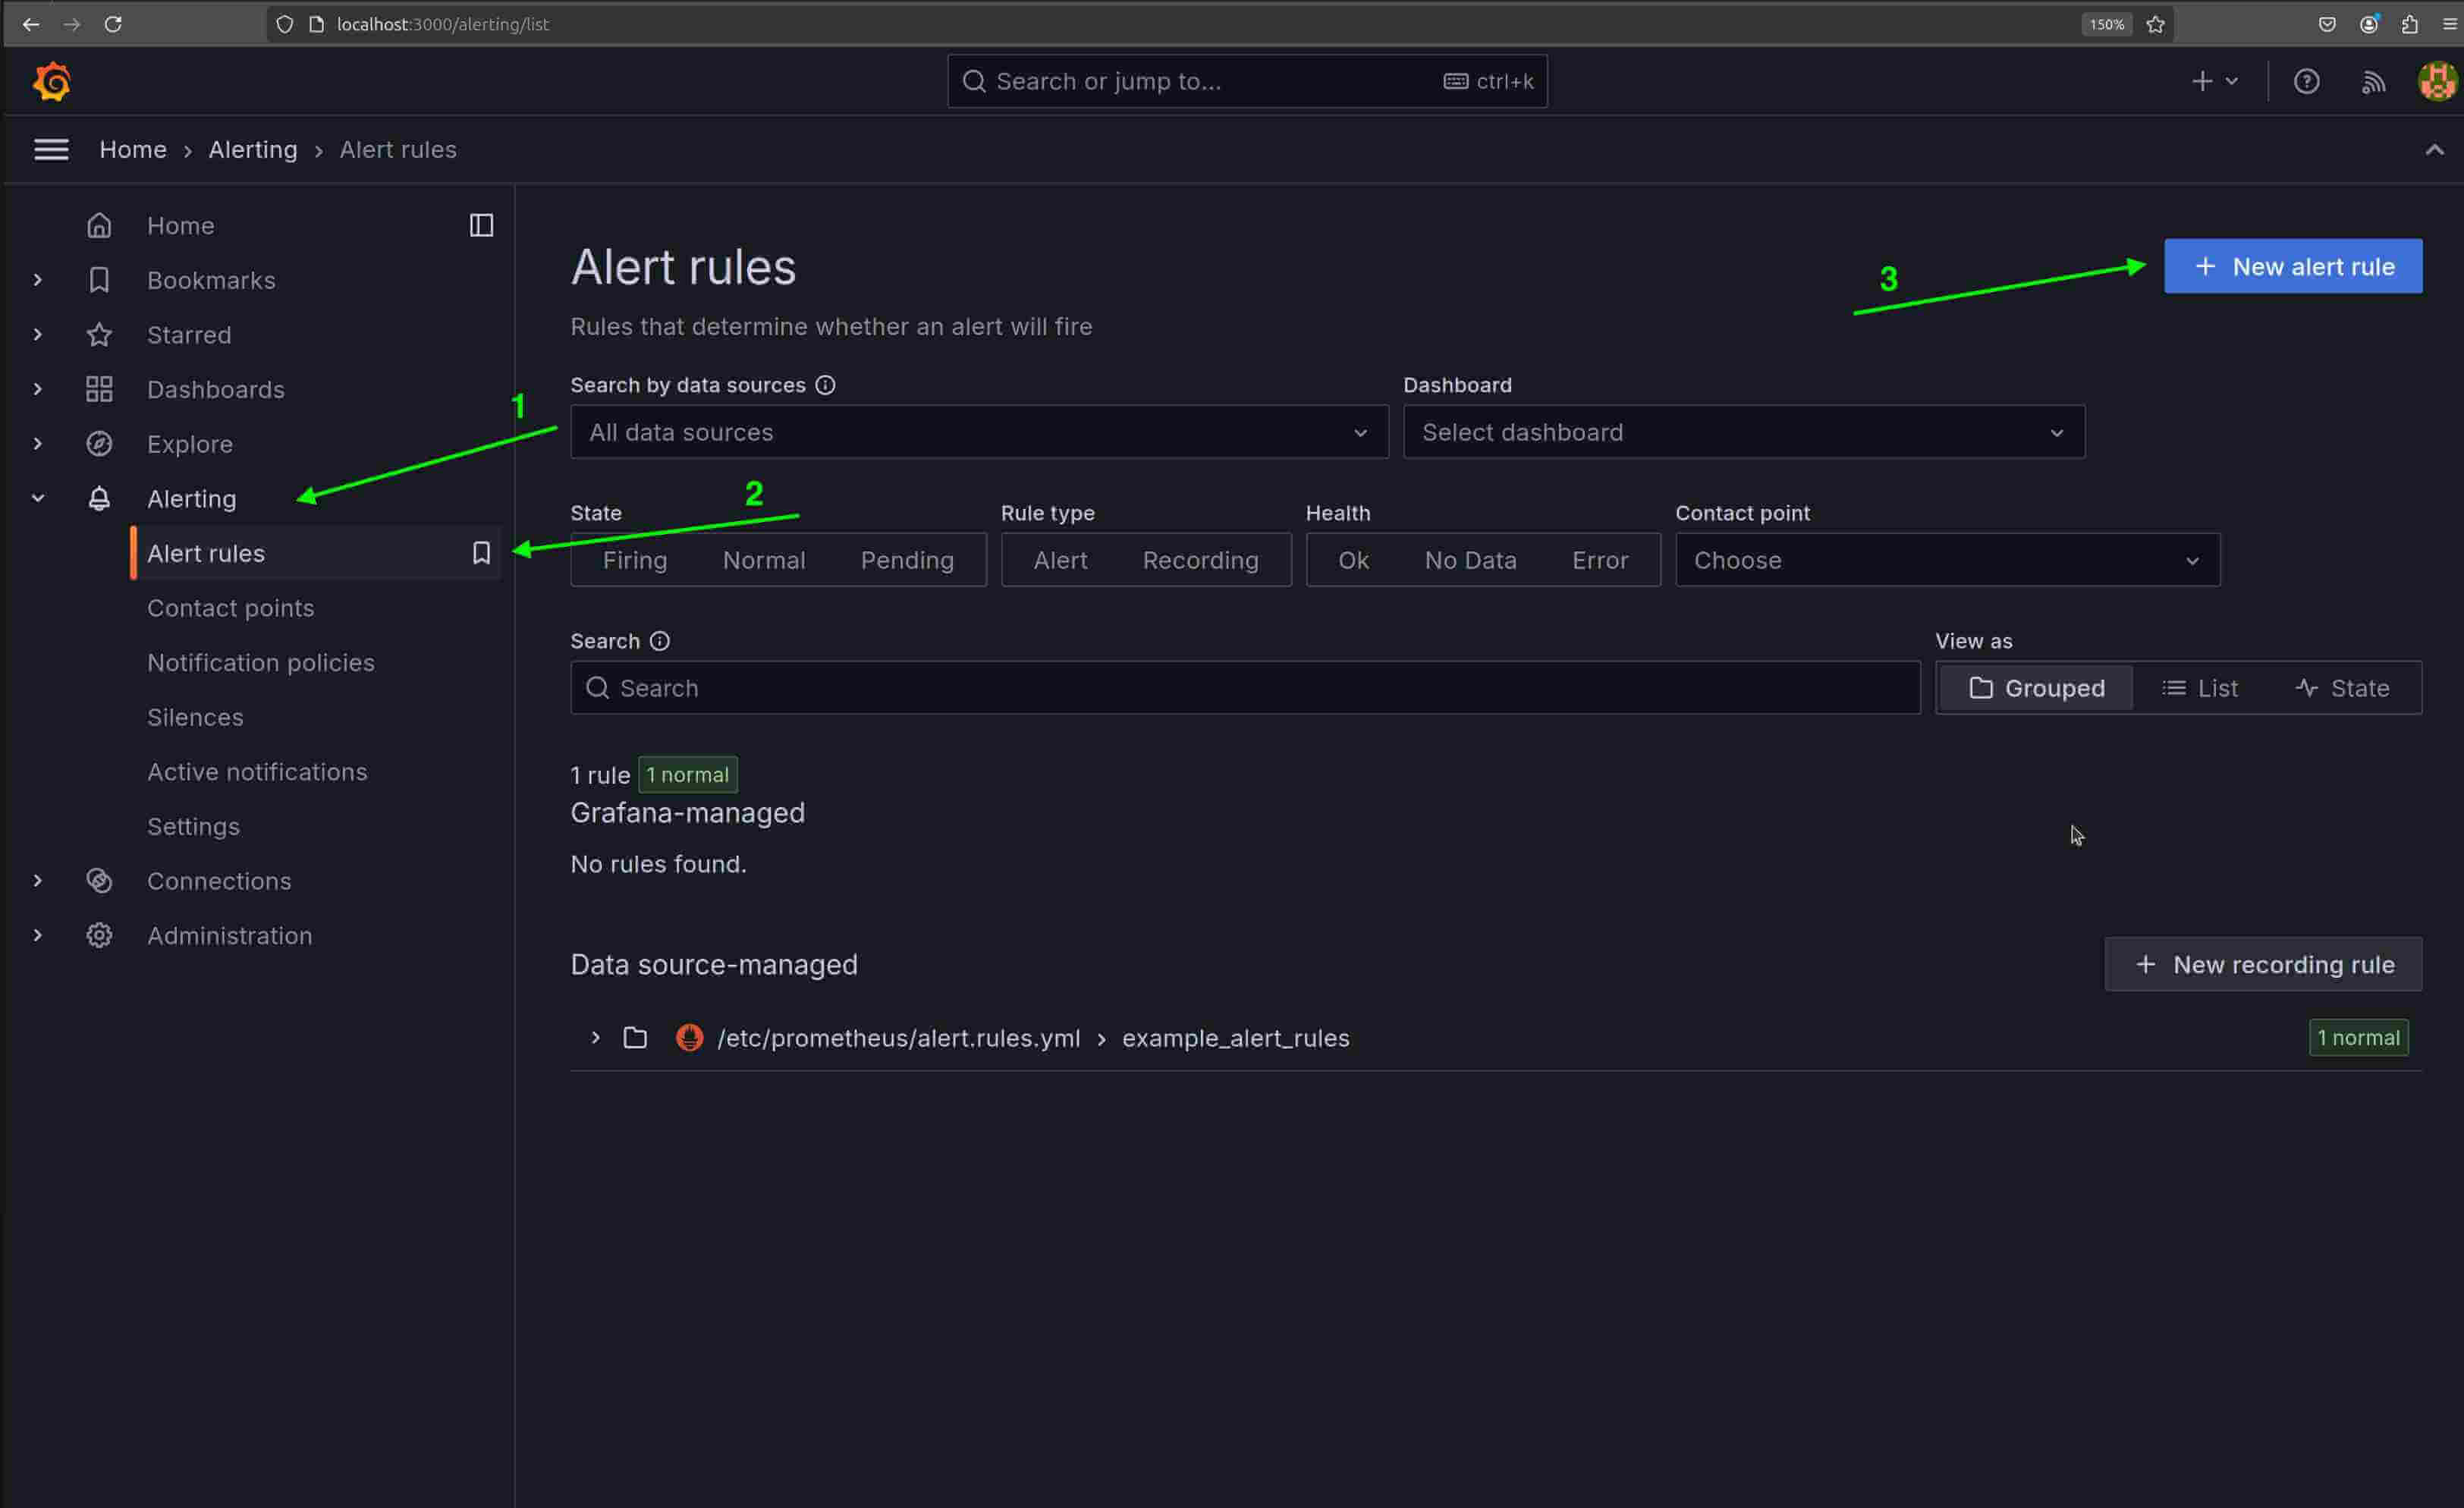
In the left sidebar, go to Alerting > Alert rules. This page shows all existing alert rules, here you can manage, create, and view the status of alerts.
Click the + New alert rule button on the right side of the screen to open the alert rule configuration window, where you can define the conditions that will trigger the alert:
-
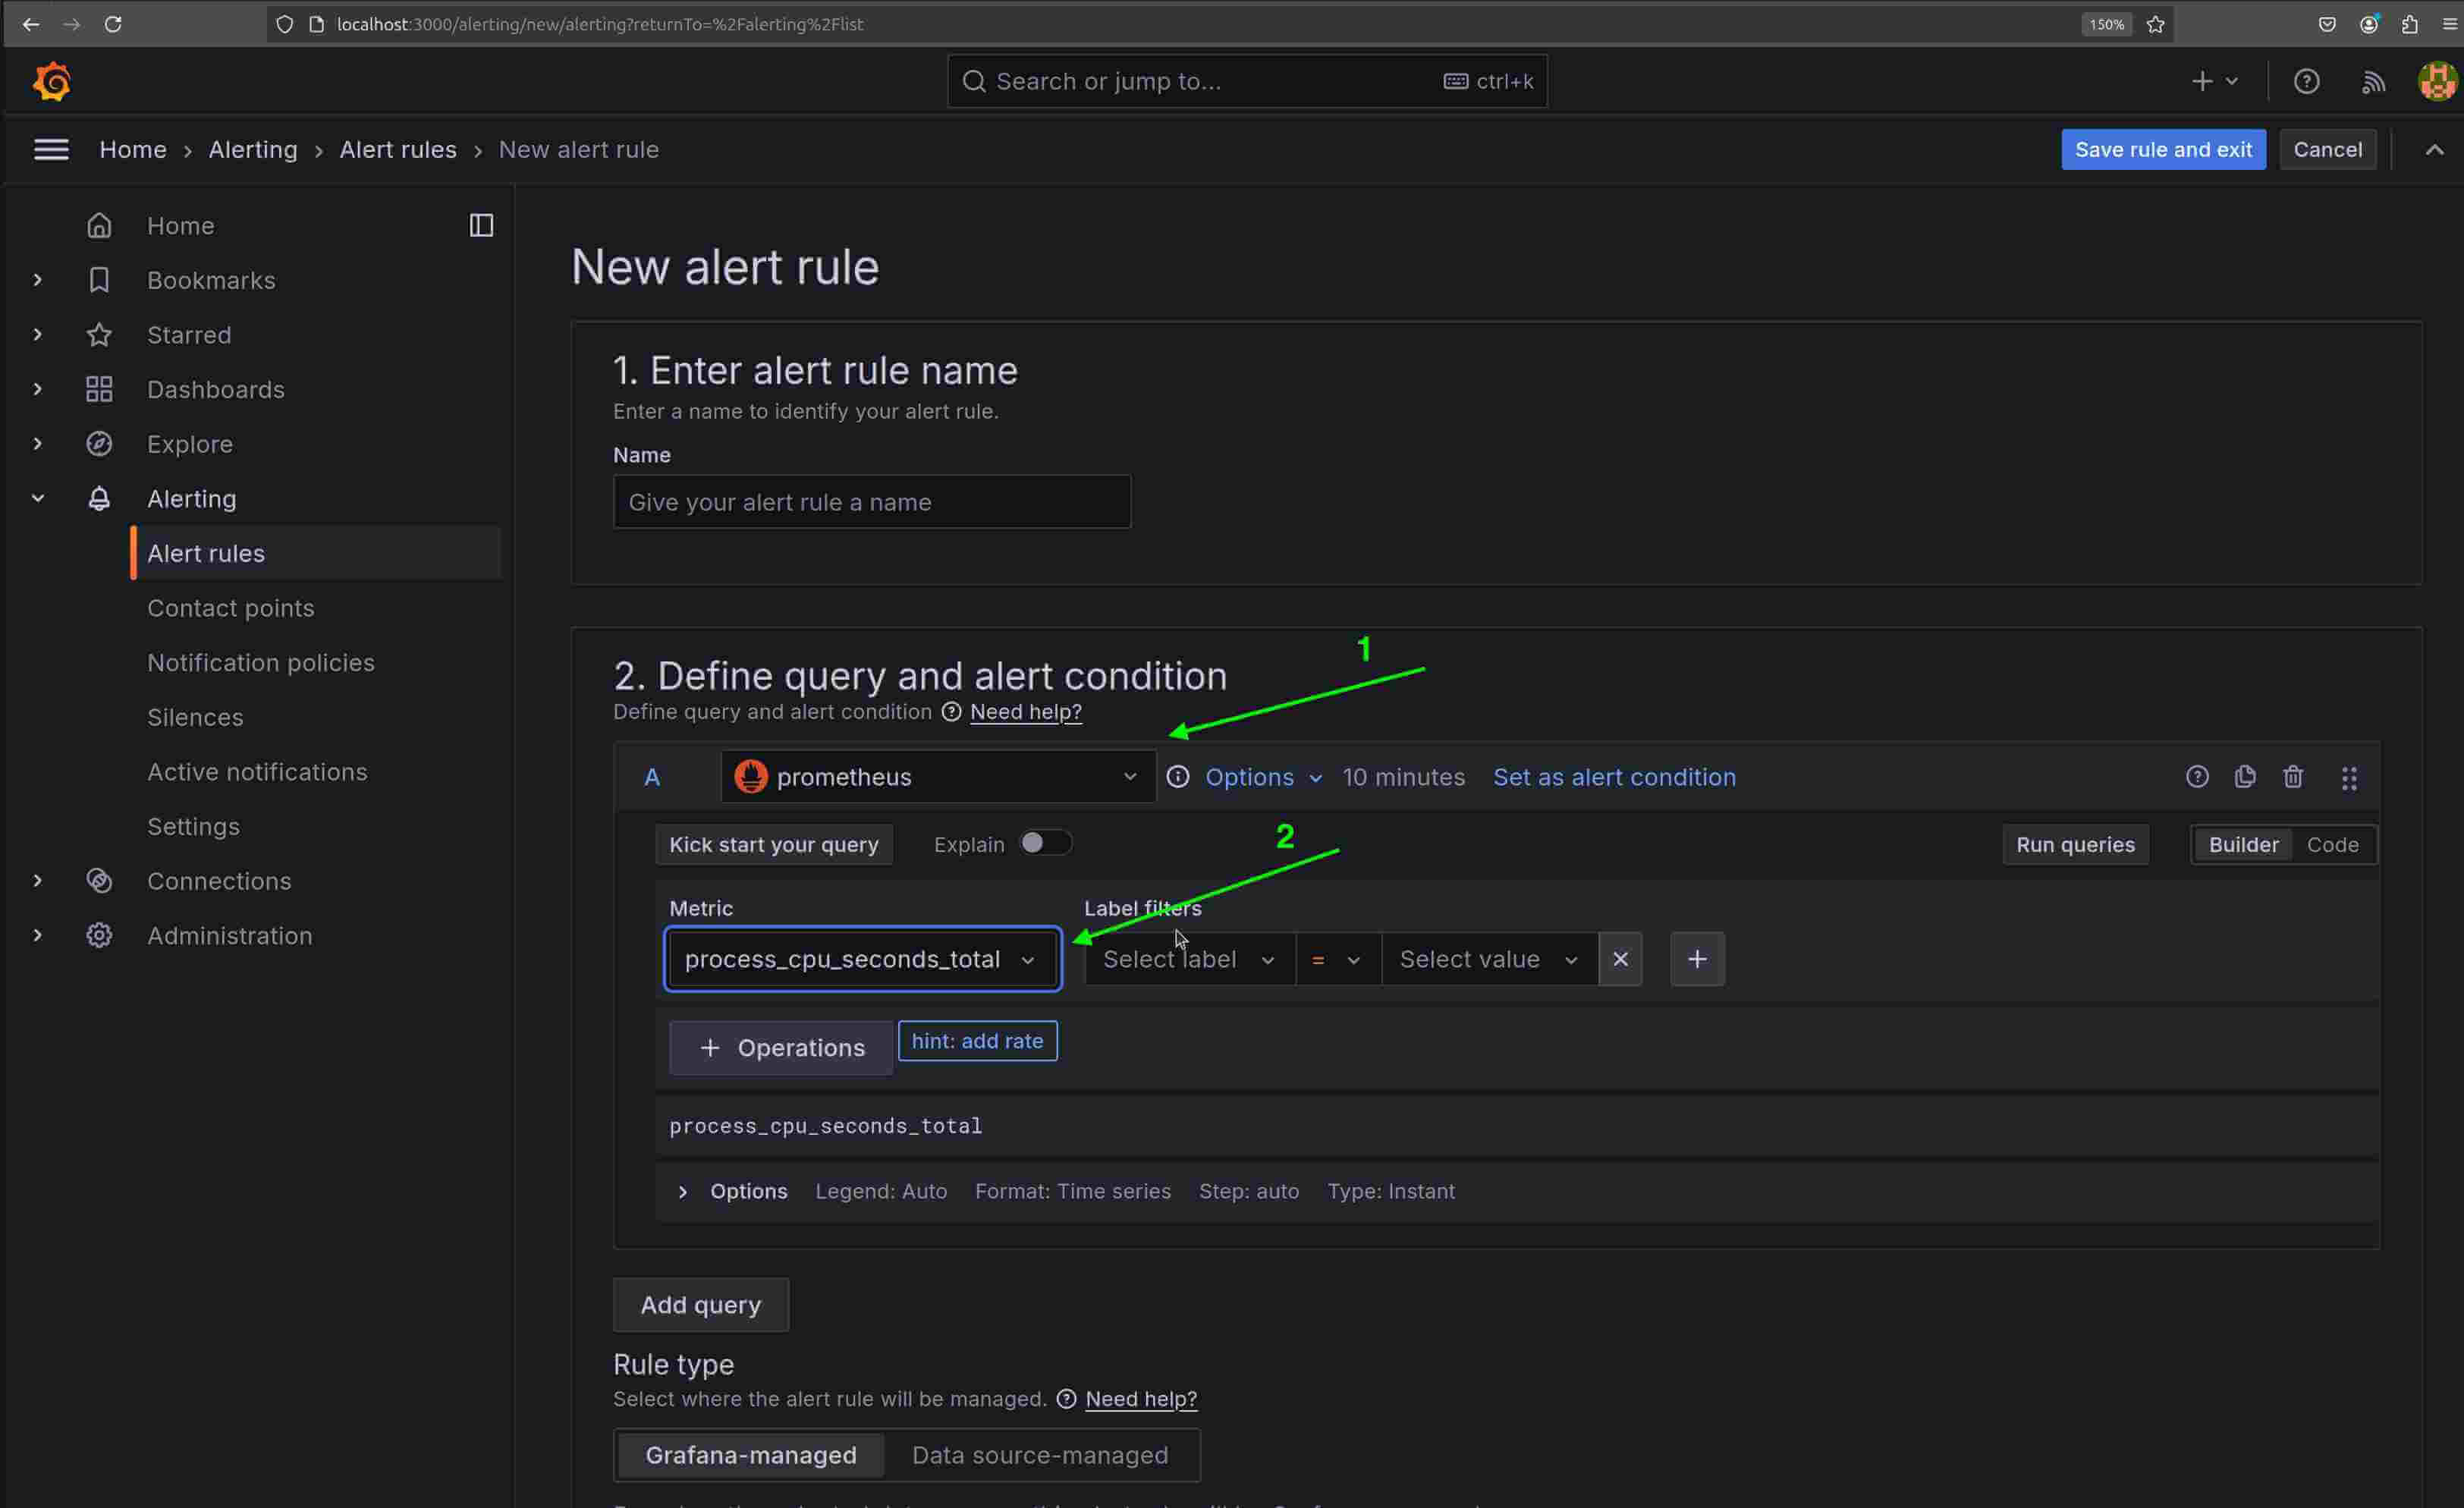
Select a data source and define a metric:
In the Define query and alert condition section, choose your preferred data source, such as Prometheus. Next, in the Metric field, enter the name of the metric you want to monitor:
-
Set the Alert condition:
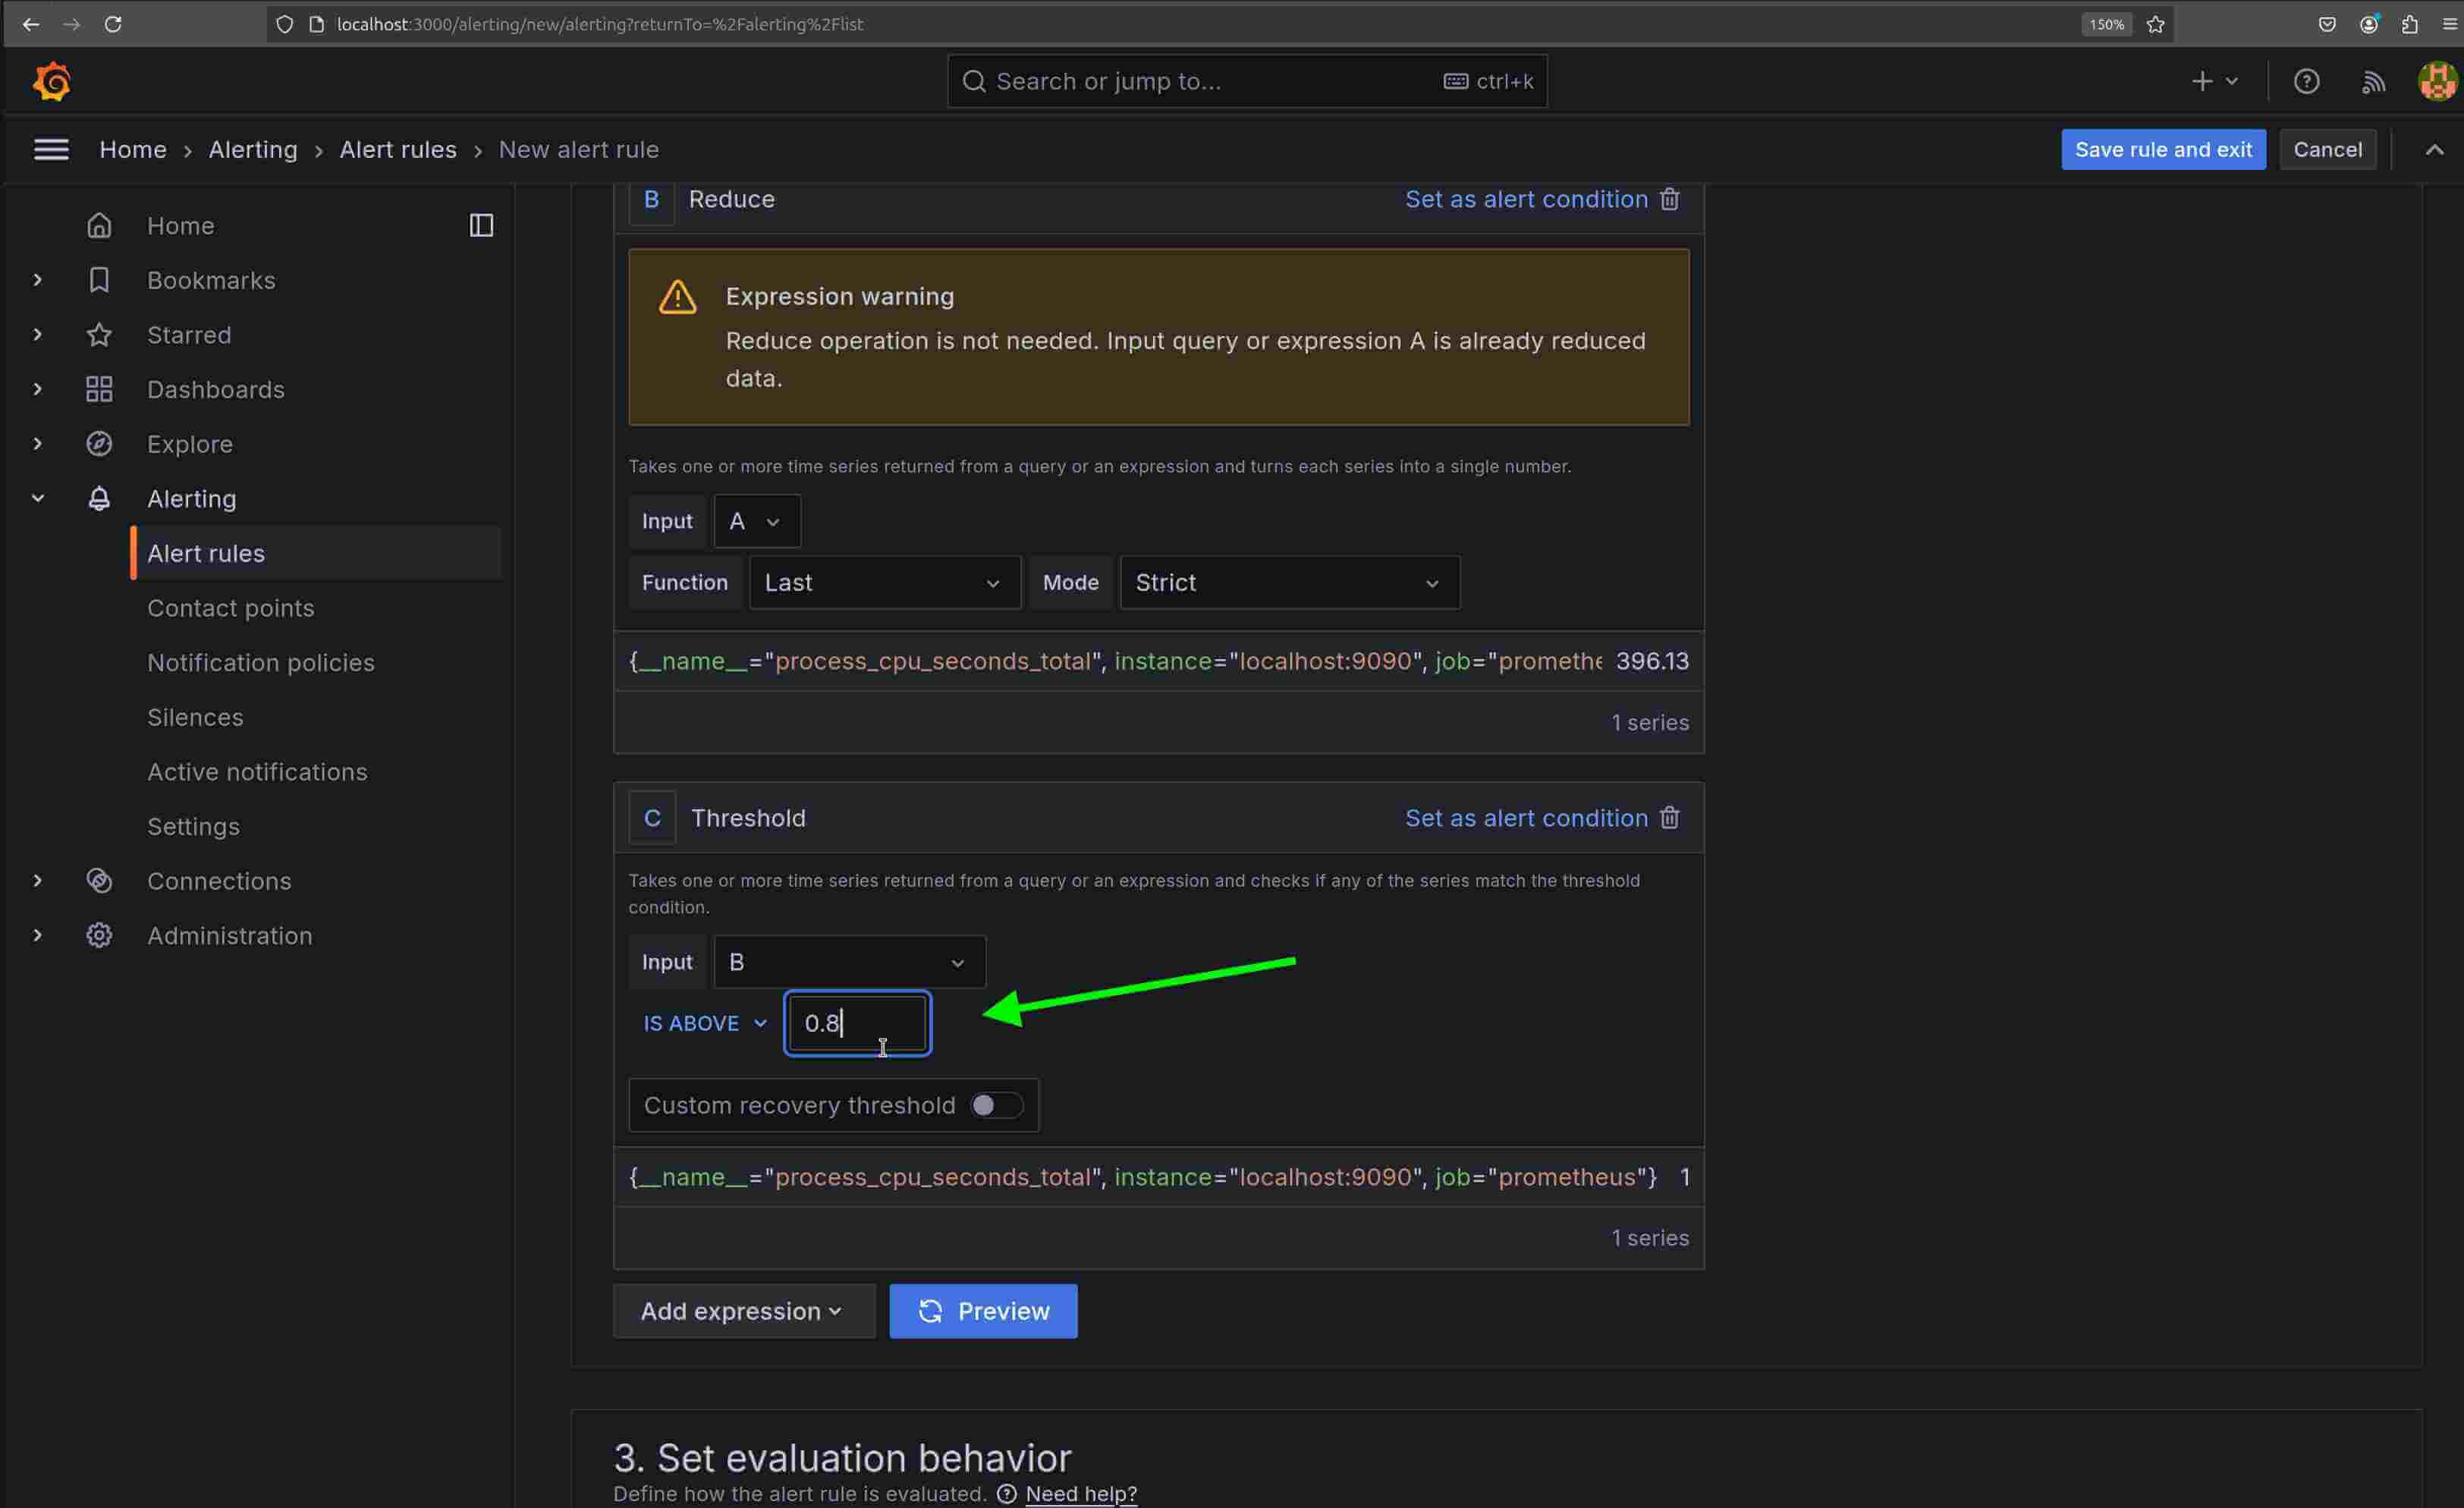
Once you’ve defined your query, click Set as alert condition to use it as the alert’s trigger condition.
In the Threshold section, you can specify when the alert should be triggered. For instance, you can configure the alert to trigger if the metric value is above or below a certain threshold:

-
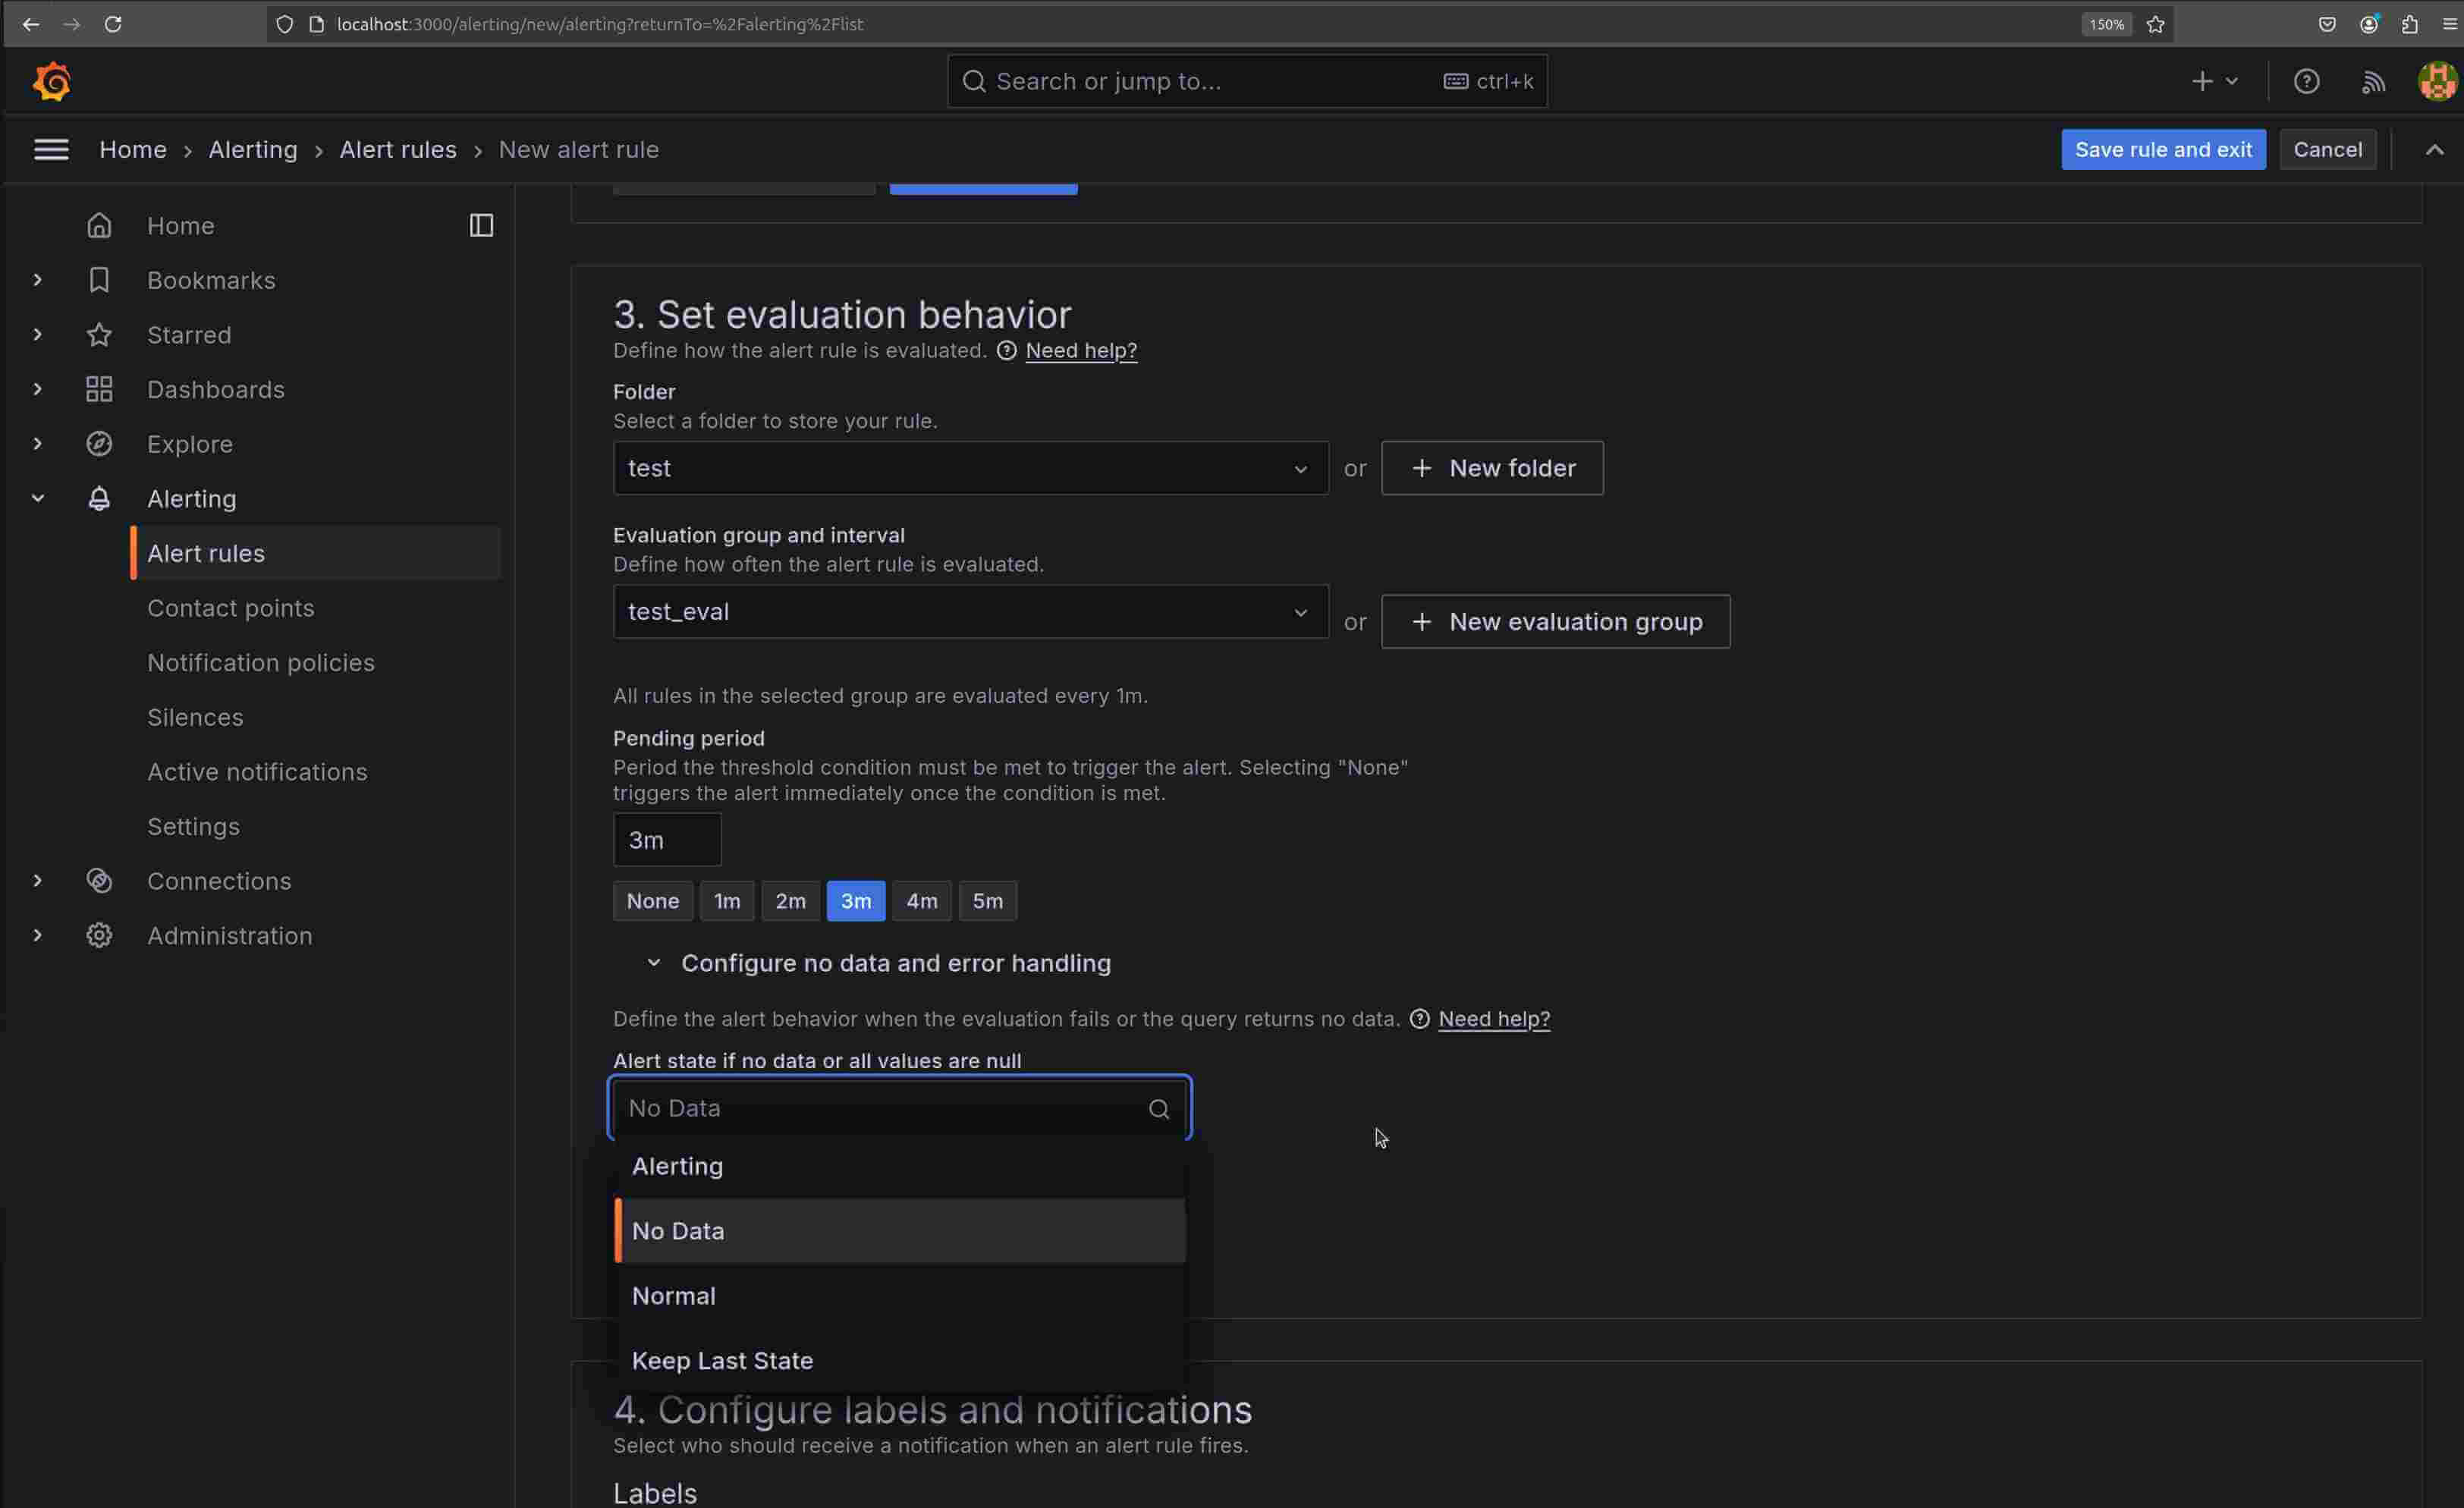
Define evaluation behavior:
In the Set evaluation behavior section, you can configure how long the condition needs to hold before triggering the alert.
In the Folder field, select a folder to store your alert rule, or create a new folder by clicking + New folder. Organizing rules in folders can make managing multiple alerts easier.
Next, under Evaluation group and interval, you can select an evaluation group or create a new one using + New evaluation group. Evaluation groups help to organize and manage alerts that share similar intervals.
The Pending period setting allows you to specify how long the condition must remain before the alert triggers. For example, if you set the pending period to 1 minute, Grafana will wait until the condition holds for that duration before activating the alert. Choosing None will make the alert trigger immediately once the condition is met.
Optionally, you can click Configure no data and error handling to adjust how Grafana should handle cases where there is no data or if errors occur in the query. This setting allows you to define responses to potential issues.
-
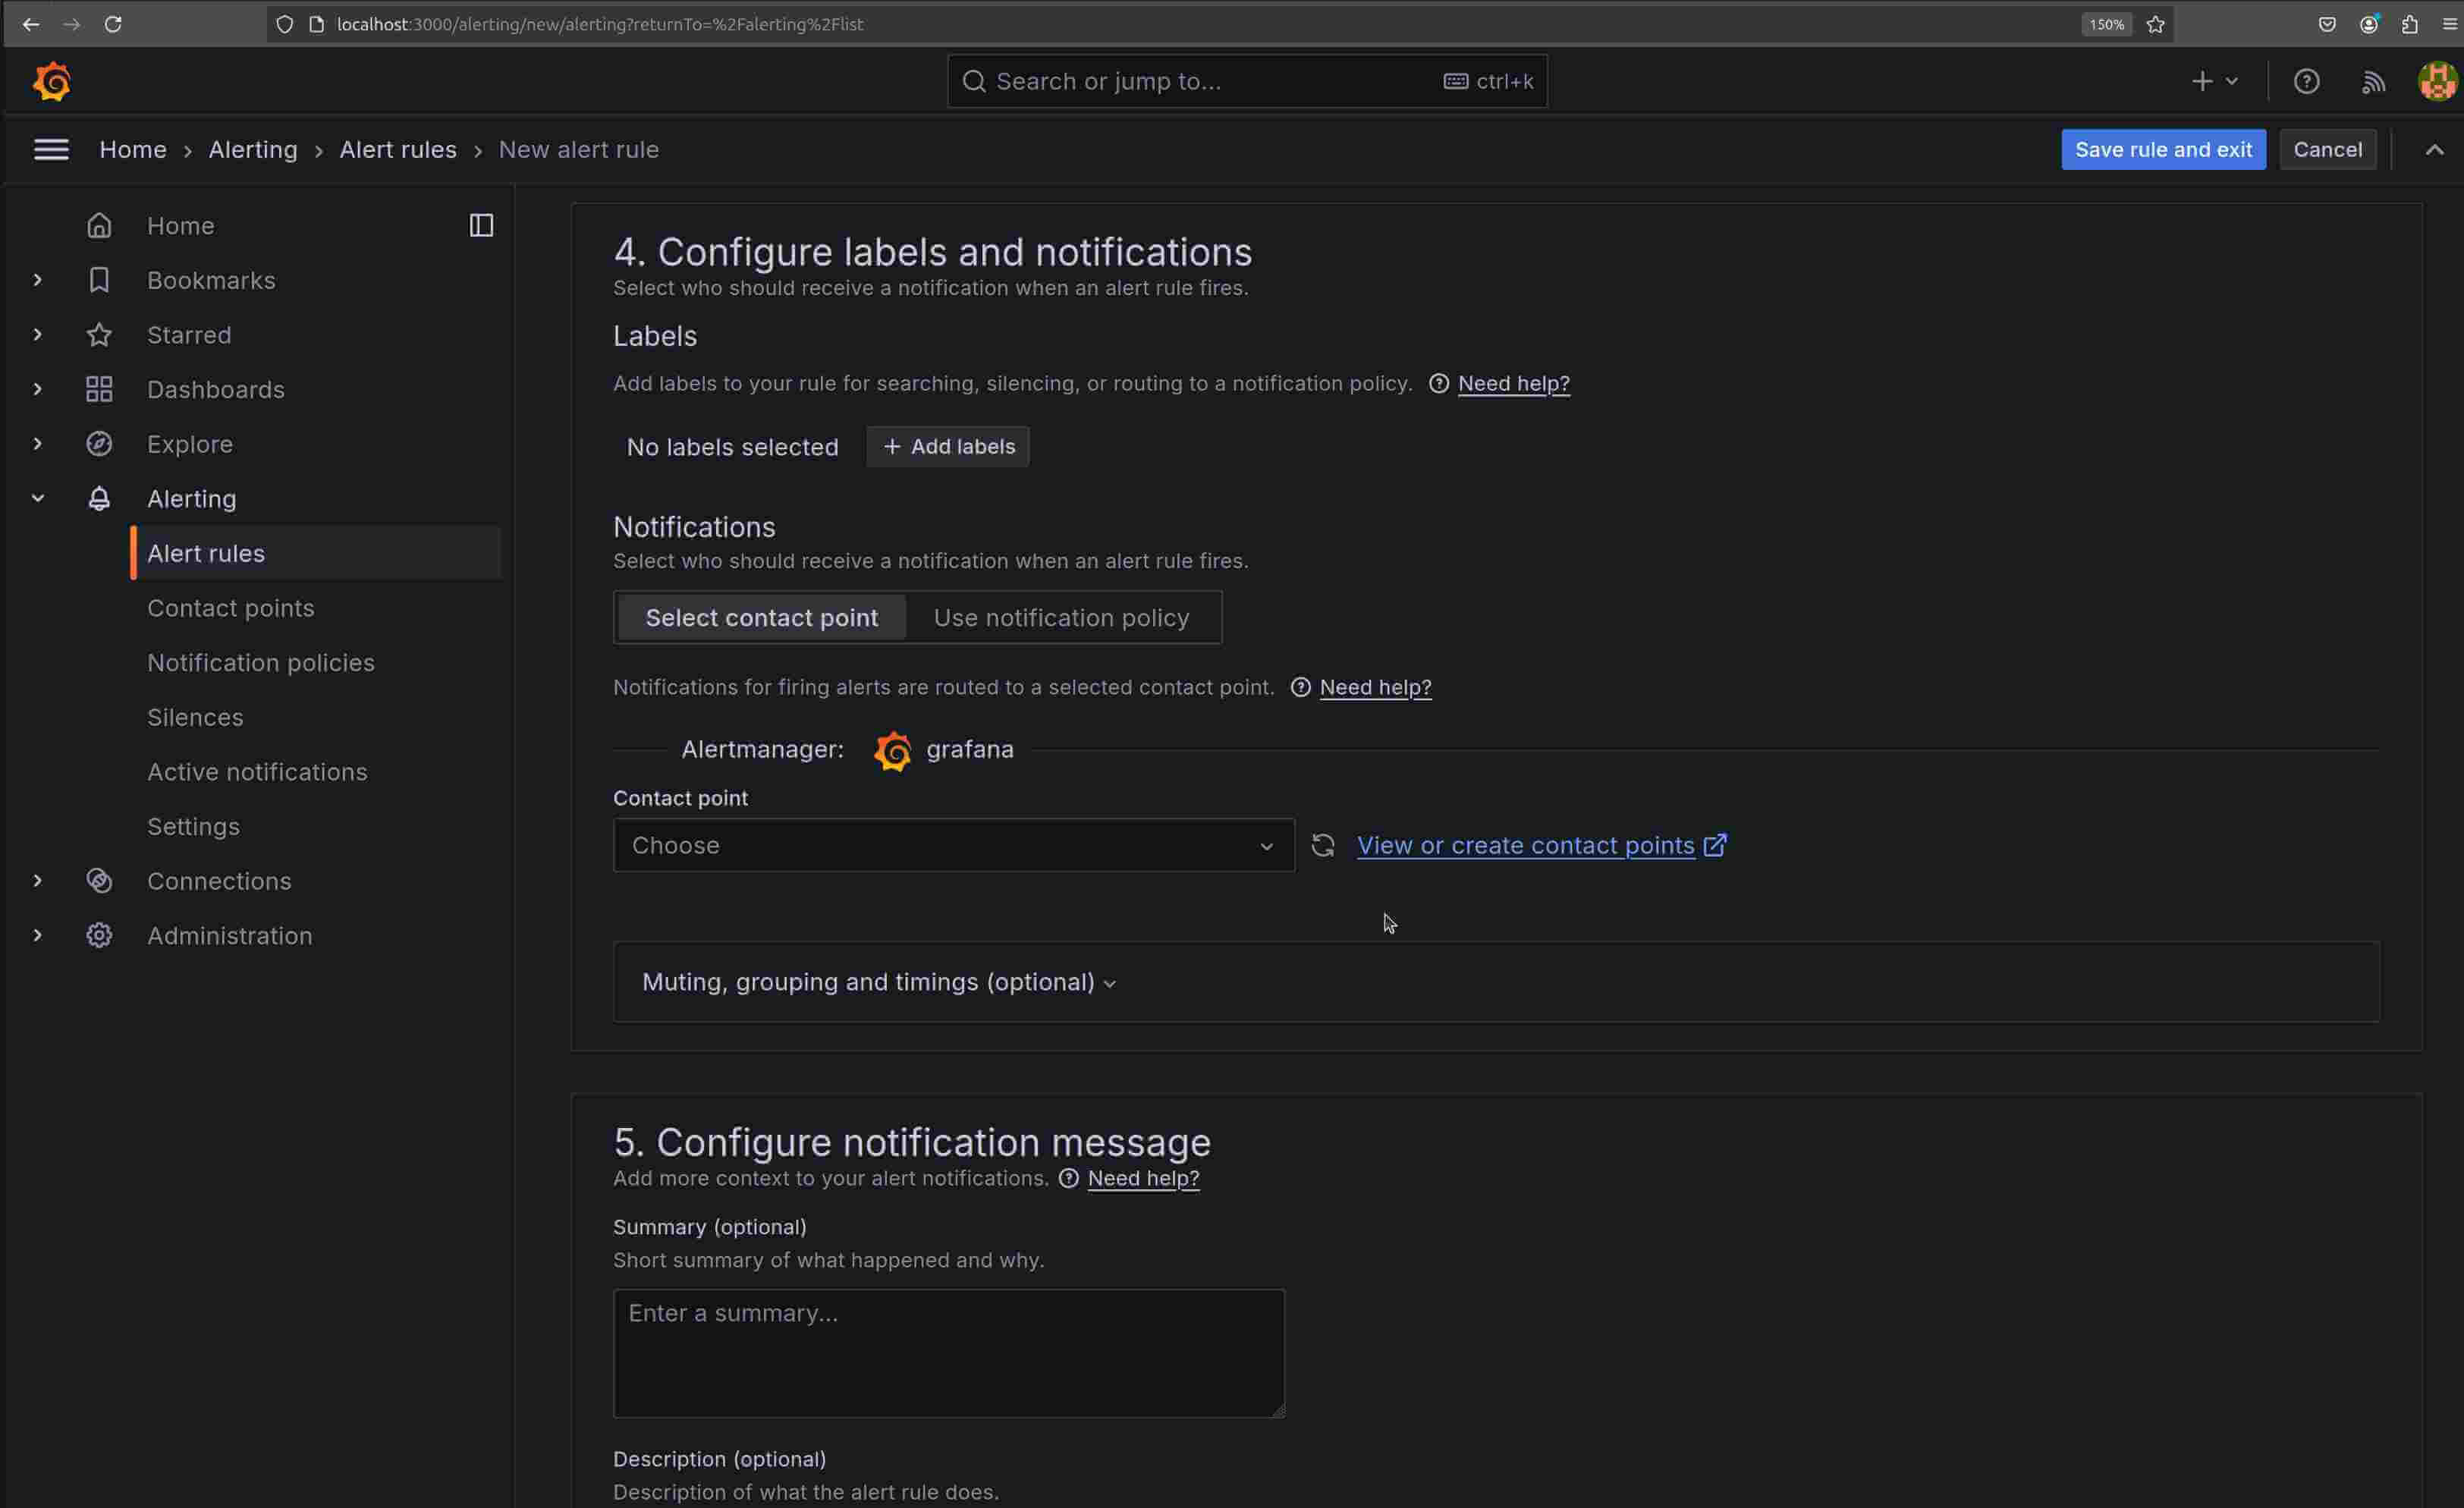
Configure labels and notifications:
In this section, assign labels to your alert rule to help with categorization and filtering. Click + Add labels to include labels relevant to your alert.
For notifications, select who should be alerted when this rule triggers. Click Select contact point and choose an existing contact point or create a new one by following the View or create contact points link. Contact points allow you to specify where notifications are sent, such as email or Slack.
-
Configure notification message:
You can add details to help recipients understand the alert’s context. In Summary, provide a short description of the alert’s purpose. Optionally, use Description to give more details about what this alert monitors and why it’s important.
After setting up all configurations, click the Save rule and exit button at the top right of the screen.
#Conclusion
In this tutorial, you’ve learned how to set up and configure Grafana with Prometheus for effective monitoring. You’ve also learned how to apply best practices for smooth operation. However, there’s much more to explore. You can explore more advanced techniques from Prometheus and Grafana’s docs.