How to Install Grafana on Ubuntu 22.04 | 9 Steps


Grafana is a valuable tool that allows users to perform in-depth data analysis to gain insights into the behavior and performance of their system or application. This article will walk you through how to install Grafana on Ubuntu 22.04.
By the end of this guide, you should be ready to take advantage of Grafana's capabilities to monitor and visualize your data effectively.
#What is Grafana?
Grafana is a popular open-source analytics and interactive visualization web application designed for monitoring and visualizing data and creating interactive dashboards. It allows you to query data and build graphs, charts, and dashboards of the data (metrics & logs) from various supported data sources, making it easier to interpret and understand the data.
#What is Grafana used for?
Grafana enables you to create interactive and visually appealing dashboards for data visualization, similar to Tableau or its competitors. It allows real-time monitoring of various data sources, for example, for monitoring Kubernetes clusters, and supports in-depth data analysis, providing insights into your system's performance. This can help you make more informed decisions. Grafana also allows you to set up alerts based on predefined conditions, notifying you of issues before they become problems.
#Prerequisites
This is a practical demonstration will show you how to install Grafana on Ubuntu 22.04 with practical examples, and to follow along, make sure you have:
- An Ubuntu server (for this demonstration, a server from Cherry Servers was used).
- A non-root user with sudo access
Not using Ubuntu 22.04? Check our guide on How to Install Grafana on Ubuntu 24.04
#How to Install Grafana on Ubuntu 22.04: Step-by-step process
This section provides step-by-step instructions on how to install Grafana on Ubuntu 22.04 using the official APT repository.
#Step 1 - Update and upgrade
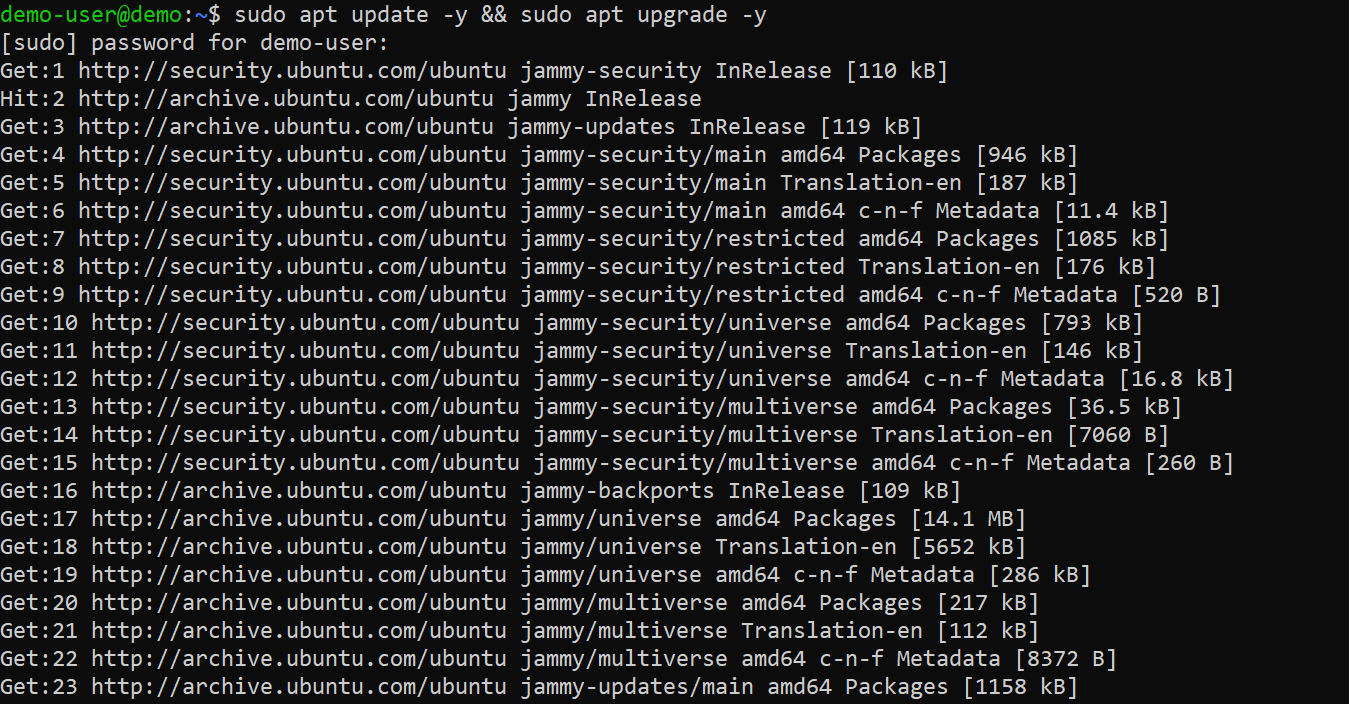
First, you want to make sure your system's packages are up to date. You can do that by running the following command in your terminal:
sudo apt update -y && sudo apt upgrade -y
#Step 2 - Install the required packages
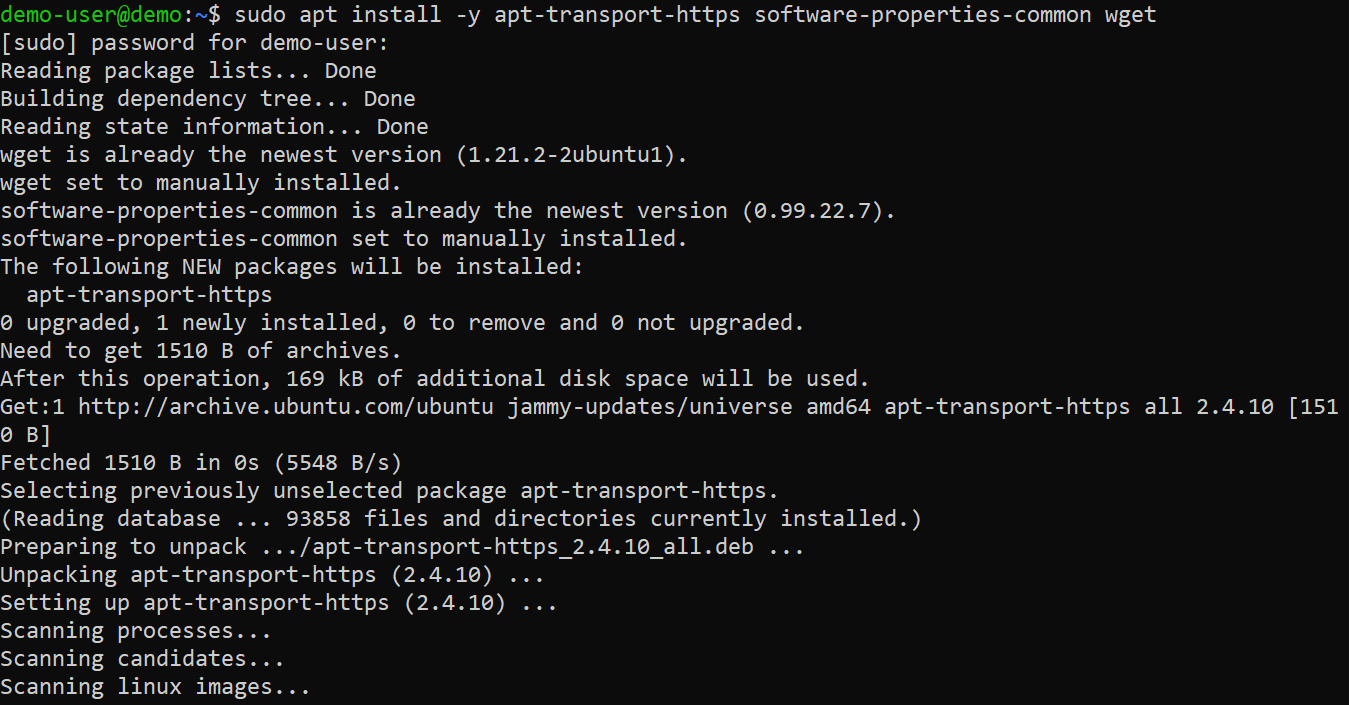
Next, run the following command to install the packages needed for the installation:
sudo apt install -y apt-transport-https software-properties-common wget
#Step 3 - Add the Grafana GPG key
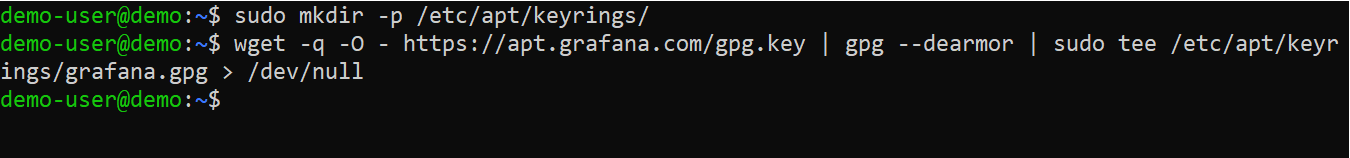
Next, download and store the Grafana GPG key with the following commands:
sudo mkdir -p /etc/apt/keyrings/
wget -q -O - https://apt.grafana.com/gpg.key | gpg --dearmor | sudo tee /etc/apt/keyrings/grafana.gpg > /dev/null
The first command creates a directory where the key will be stored. The second command will download, convert, and store the key in the specified location for secure APT package management.
#Step 4 - Add Grafana APT repository
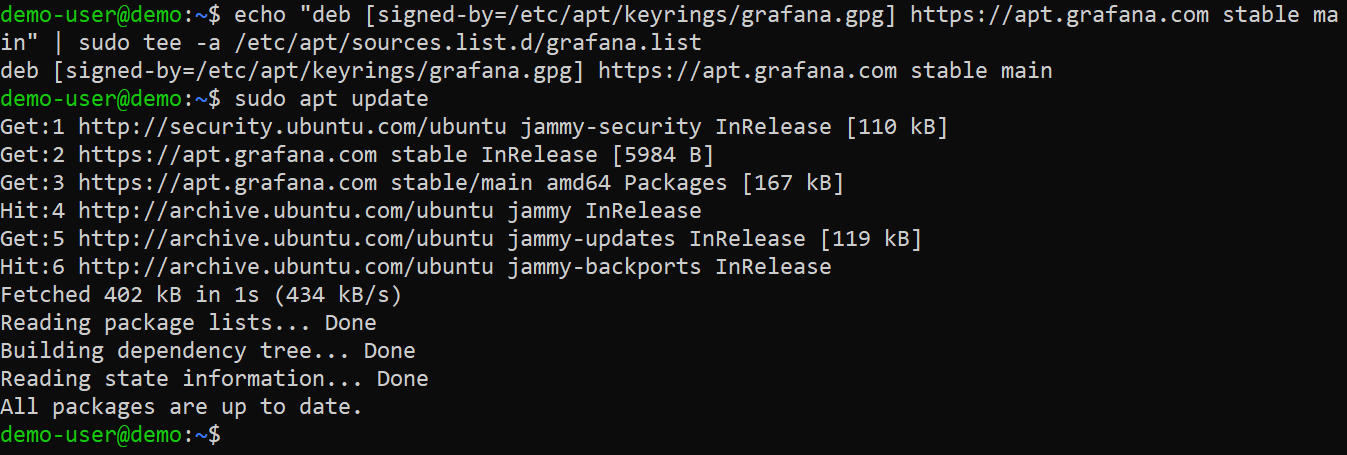
The Grafana package is not included in the default Ubuntu repositories by default. To install Grafana, you'll need to add the Grafana official APT repository to your system's APT sources. This will enable your system to recognize and retrieve Grafana packages during the installation process.
echo "deb [signed-by=/etc/apt/keyrings/grafana.gpg] https://apt.grafana.com stable main" | sudo tee -a /etc/apt/sources.list.d/grafana.list
After adding the repository to your system, update the package index to include information from the newly added repository using:
sudo apt update
#Step 5 - Install Grafana
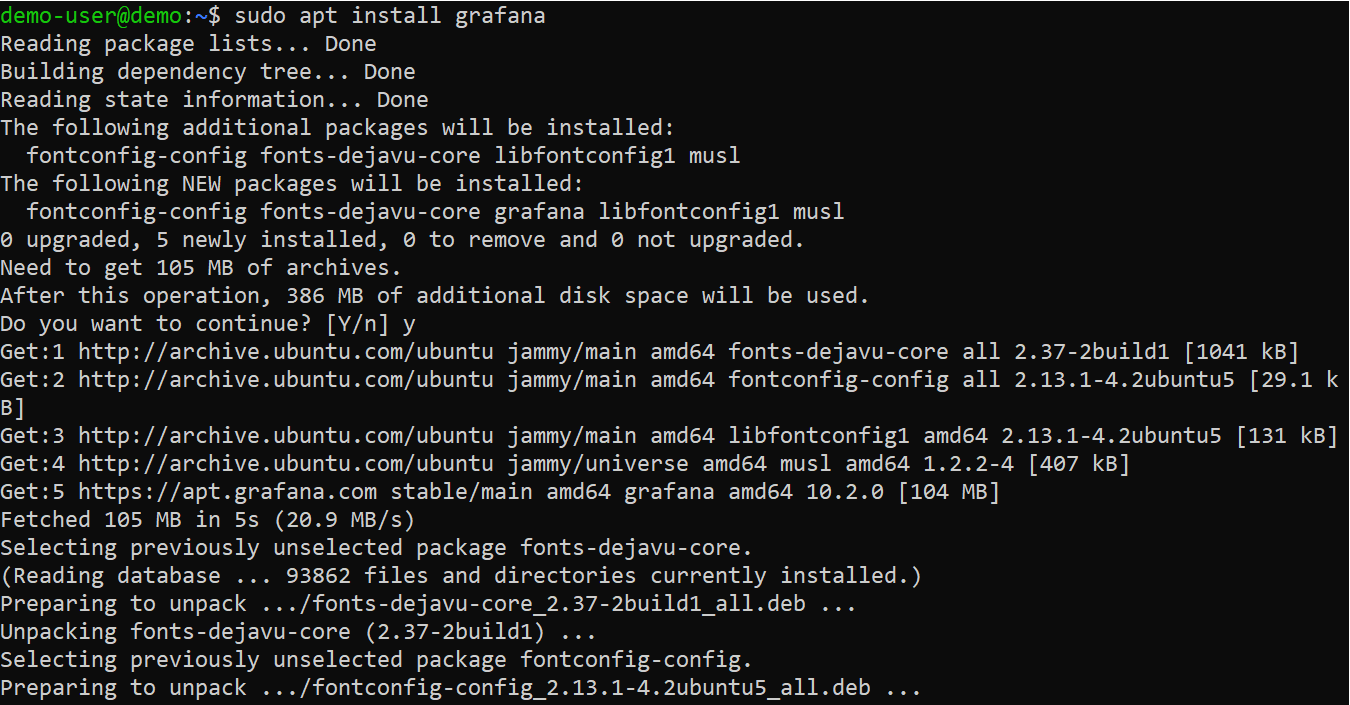
Now install Grafana using:
sudo apt install grafana
#Step 6 - Start the Grafana service
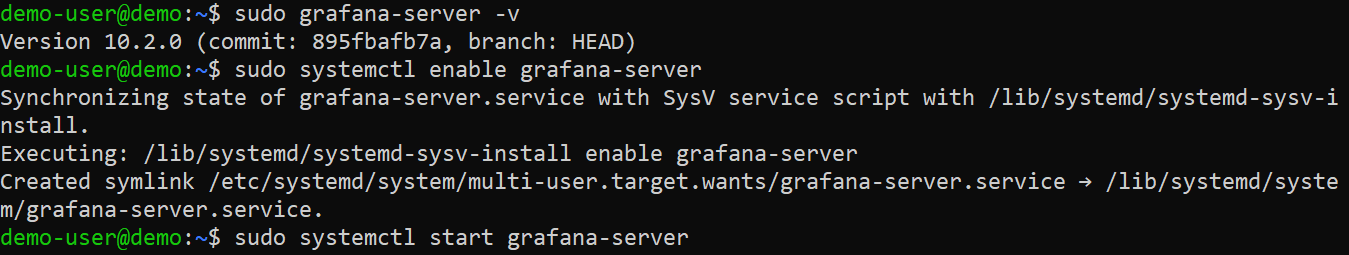
Once the Grafana installation process has been completed, you can verify the version using:
sudo grafana-server -v
Next, start the Grafana service and enable it to start automatically at system reboot using the following commands:
sudo systemctl start grafana-server
sudo systemctl enable grafana-server
#Step 7 - Verify that the Grafana service is running
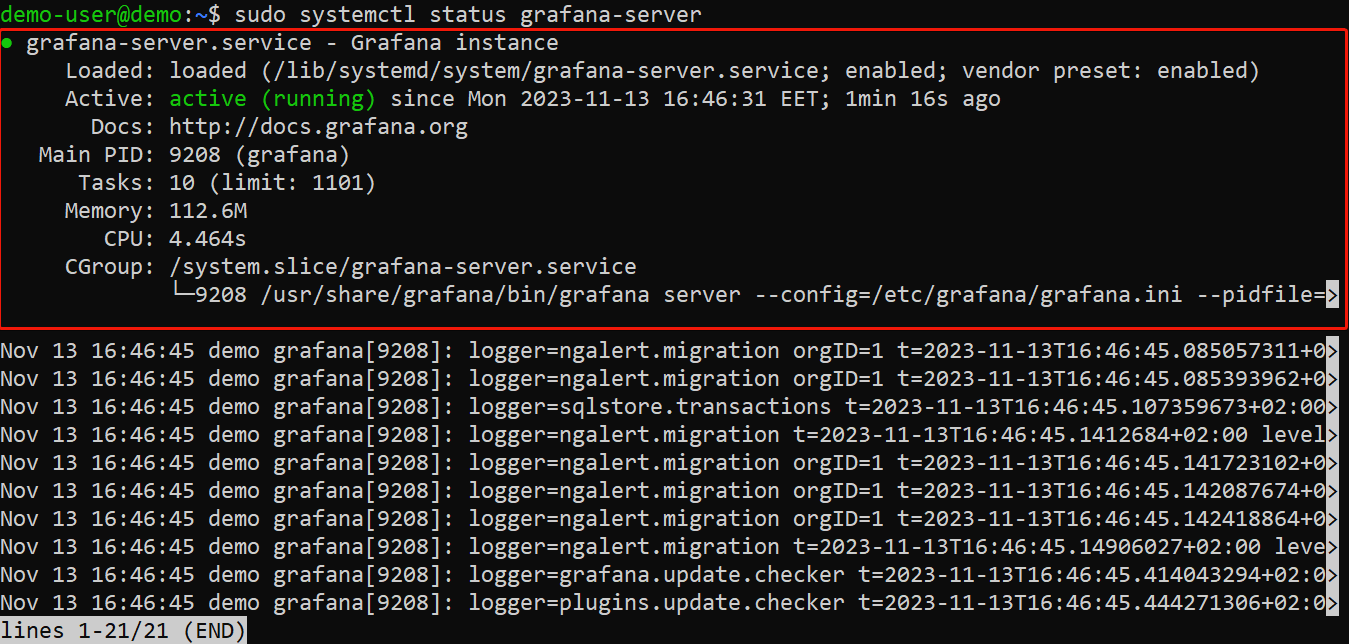
Now verify that the Grafana service is active by running the command below:
sudo systemctl status grafana-server
If the Grafana service was started successfully, you should see a sign that it is active and running.
#Step 8 - Open the port in the firewall
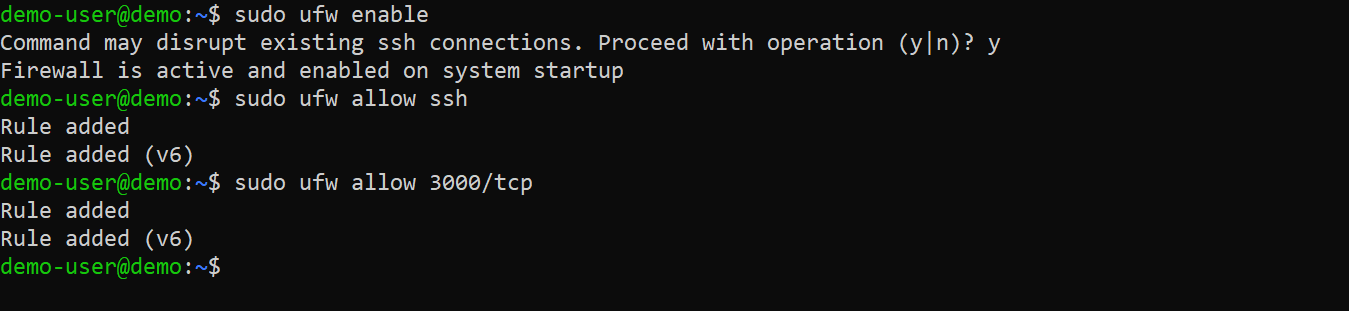
Port 3000 is Grafana's default port for its web interface. To allow external access to Grafana, you must enable the firewall and open port 3000. To do this, execute the following commands in your terminal:
sudo ufw enable
sudo ufw allow ssh
sudo ufw allow 3000/tcp
#Step 9 - Access the Grafana web interface
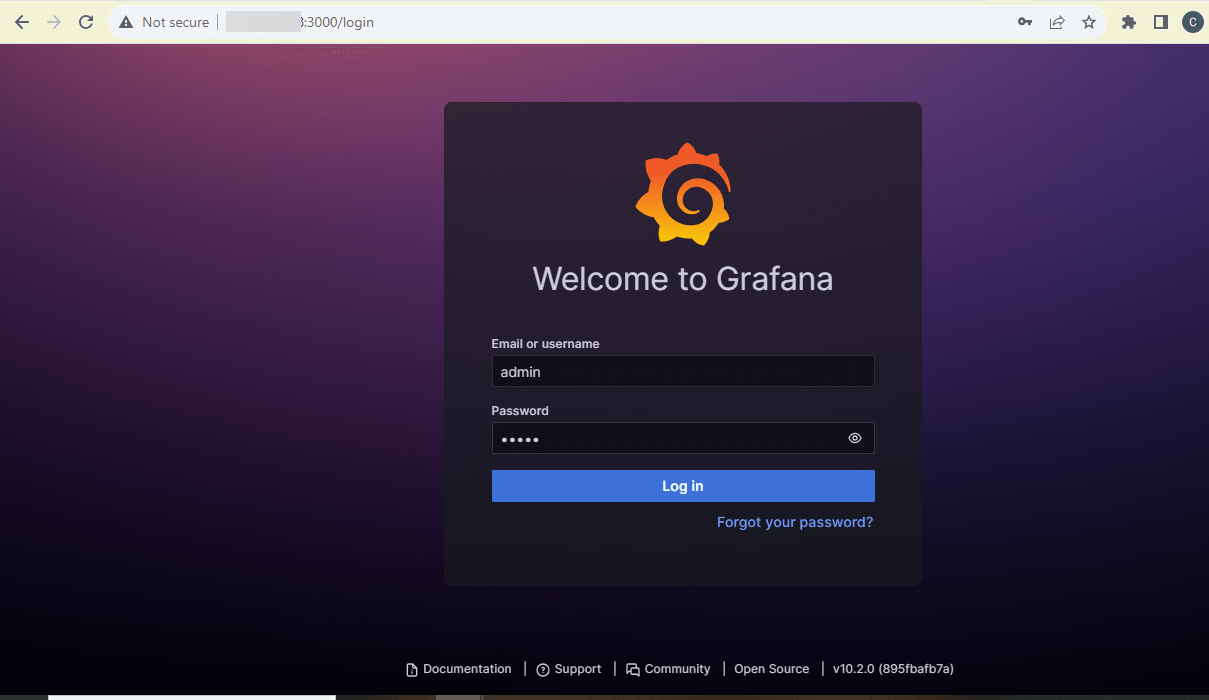
To access the Grafana web interface, open a web browser and enter the IP address of your server (or hostname if applicable), followed by port 3000. The URL format should be http://your_server_IP:3000. Once loaded, you should see the Grafana login page. The default credentials are:
- Username: admin
- Password: admin
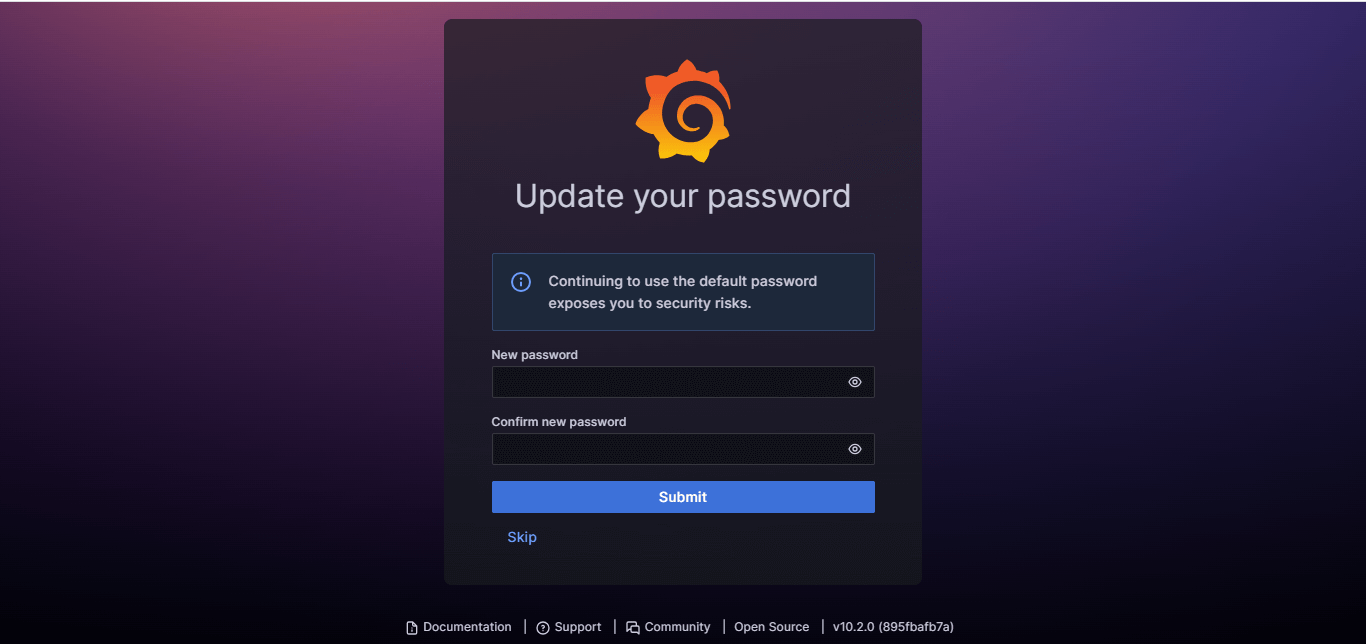
You'll be prompted to create a new password. Input a secure password, confirm it, and click the "Submit" button.
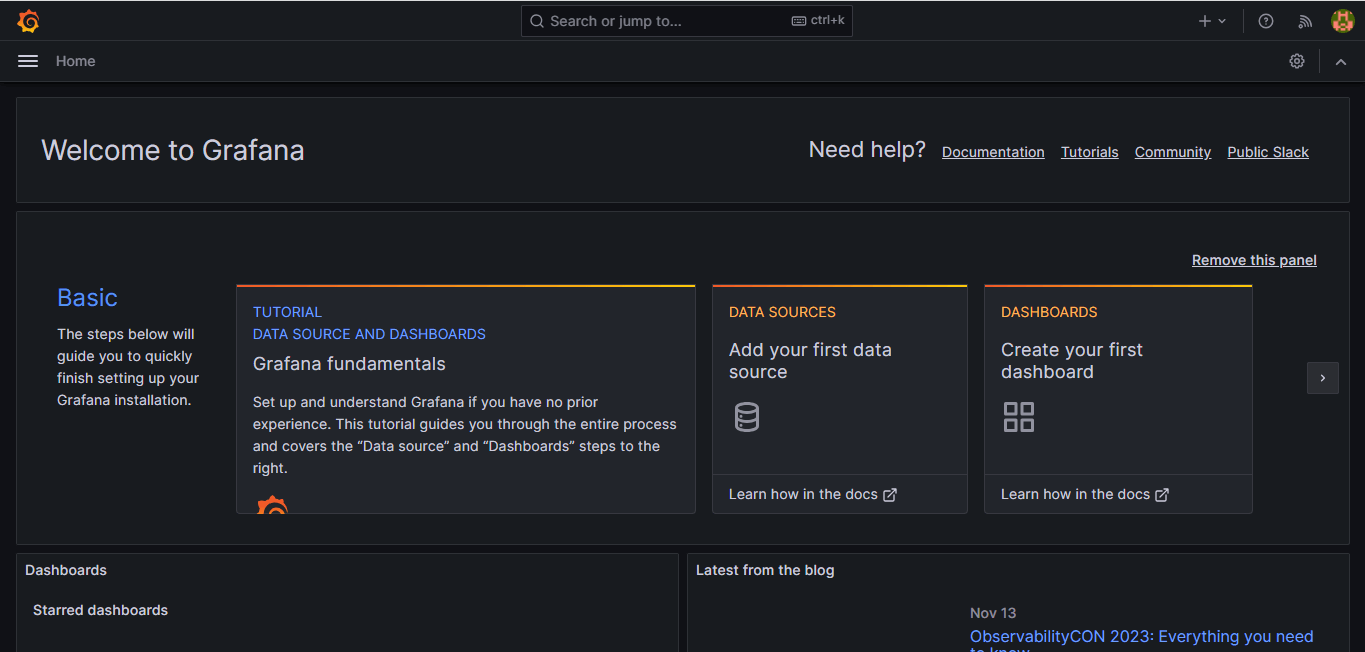
Once done, you'll have access to Grafana's dashboard.
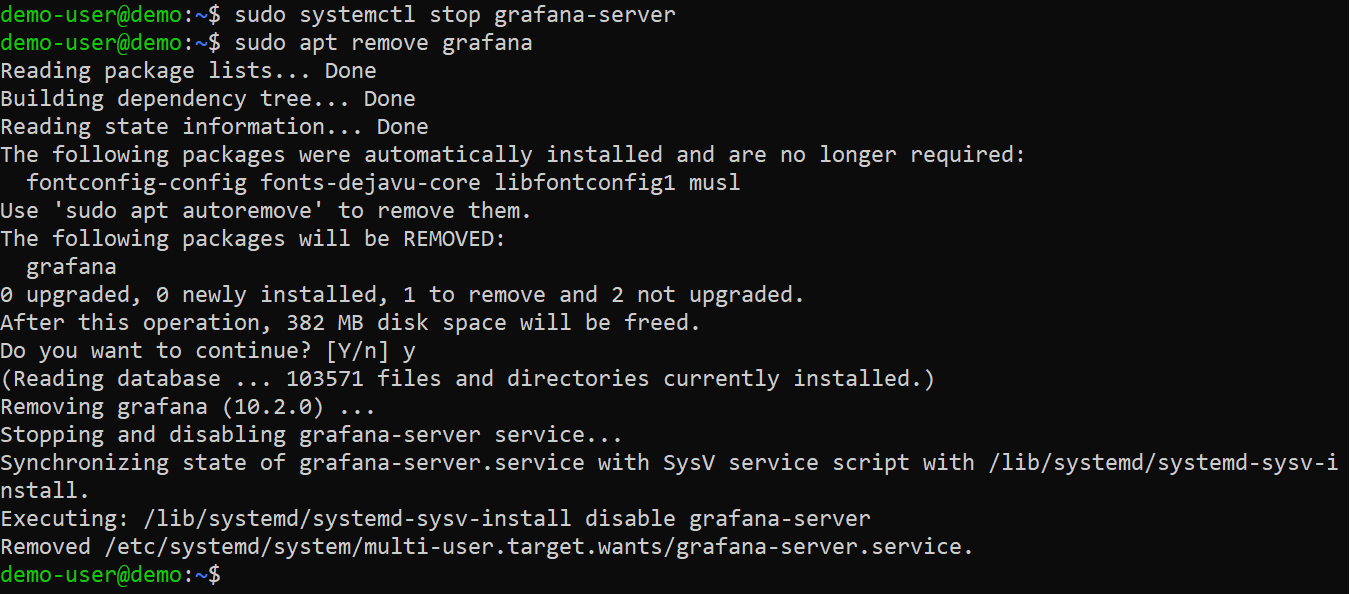
#How to uninstall Grafana
If you need to uninstall Grafana for any reason, you can do so by running the following commands:
sudo systemctl stop grafana-server
sudo apt remove grafana
Also read: Server Monitoring with Prometheus and Grafana
#Conclusion
To sum up, this guide showed how to install Grafana on Ubuntu 22.04. Whether you are an IT professional or someone monitoring a server's performance, Grafana is an important addition to your toolkit that allows you to visualize, query, set alerts for, and understand your metrics and logs from supported data sources in a user-friendly manner. At this point, you should have Grafana installed and working on your Ubuntu server, and you can now go on to explore its features. Find more information on Grafana’s official documentation.
Cherry Servers offers reliable cloud infrastructure, ideal for deploying and scaling your Grafana monitoring setup. Our range of virtual and dedicated server solutions provides a flexible hosting platform with hourly billing and free technical support 24/7.
Learn more about us here!