Kubernetes Monitoring | Tools + 9 Best Practices


Have you ever wondered how to manage cloud environments like a pro? Let us tell you: it's keeping an eye on your Kubernetes clusters. Understanding the "what," "why," and "how" of Kubernetes monitoring is pivotal, and that's what we're going to unravel today.
Software development is full of challenges, and monitoring applications is at the top. The biggest hurdle is determining what to monitor and decode the messages these signals send.
That's where Kubernetes steps in. Stick around as we examine what Kubernetes monitoring is and how it works. We also highlight the top Kubernetes monitoring tools and some best practices for monitoring Kubernetes clusters. Let's dive right in.
#What is Kubernetes?
Kubernetes is an open-source platform that simplifies managing containers across clusters, making it a developer's best friend. But here's the catch – Kubernetes environments are dynamic, scalable, and dispersed. That brings a whole new dimension to monitoring your Kubernetes infrastructure and applications.
#What is Kubernetes monitoring?
Kubernetes monitoring is a form of reporting that tracks the performance and health of your Kubernetes clusters. It focuses on key metrics such as memory, CPU, and storage utilization, providing insights into your containerized infrastructure.
For example, imagine running a bustling city (your Kubernetes cluster). As the mayor (cluster operator), you'd want to keep tabs on everything - from energy consumption (CPU usage) to infrastructure health (pod status).
In real-time, Kubernetes monitoring is like your city management dashboard, alerting you about any anomalies or approaching limits, so you can proactively manage your city (cluster) and keep it running smoothly.
#Why monitor Kubernetes clusters?
Monitoring your Kubernetes clusters is crucial for a couple of reasons. Firstly, the evolution of containers has transformed the landscape of app development and deployment. This makes Kubernetes a go-to for many enterprises. Its scalability and flexibility are major wins, but they also add layers of complexity.
Moreover, with services like AWS containers or Cherry Servers spot servers for self-managed Kubernetes clusters offering enhanced portability and scalability, Kubernetes becomes an ideal platform for managing containerized workloads across cloud environments, necessitating robust monitoring practices.
With applications no longer bound to specific servers, they're abstracted by containers and Kubernetes. This level of abstraction can be dizzying without the right tools, making monitoring a lifeline.
Secondly, keeping tabs on your Kubernetes clusters allows you to proactively spot and address potential issues before they impact your operations or, worse, your users. Monitoring gives you the insights to stay ahead of these issues, whether:
- It's a spike in resource usage;
- The failure of a node;
- A misconfigured pod.
#What metrics to monitor in Kubernetes?
Monitoring Kubernetes is all about piecing together the right metrics. Here's a quick rundown. Each of these metrics offers a unique perspective, and together, they paint a comprehensive picture of your Kubernetes clusters' health and performance.
- Cluster state metrics: This gives you an overview of your pods' health and availability. Think of it as a quick health check of your Kubernetes ecosystem;
- Node status: Ever heard of the saying, "A chain is only as strong as its weakest link"? Similarly, you need to ensure each node in your cluster is in tip-top shape. Watch out for memory, disk, or processor overloads and network availability;
- Pod availability: Unavailable pods could indicate misconfigurations or poorly designed readiness probes. Keeping track of this helps avoid unwanted surprises. To gather basic monitoring information like pods or details of your nodes, you can use kubectl commands;
- Memory utilization: This metric, monitored at both the pod and node level, helps ensure your resources are used efficiently, and you're not wasting precious memory;
- Disk utilization: Lack of space for file system and index nodes can impact your cluster's performance. So, it's crucial to monitor disk usage closely;
- CPU utilization: It's all about balance here. This metric, which relates to the amount of CPU resource allocated to the pod, helps prevent CPU throttling or underutilization;
- API request latency: Think of this as your speedometer. Measured in milliseconds, a lower number indicates better latency, translating to faster responses.
Build and scale your self-managed Kubernetes clusters effortlessly with powerful Dedicated Servers — ideal for containerized workloads.
#Commonly used Kubernetes monitoring tools
The Kubernetes ecosystem is intricate and containerized applications may be spread out over various environments. To effectively monitor the system, it's crucial for monitoring solutions to gather and organize metrics from all the distributed resources, while also managing the temporary nature of containerized resources.
These tools deal with the challenges of monitoring Kubernetes and containers through features like resource monitoring, alerting, cluster health checks and aggregation of metrics across distributed environments.
Below are some commonly used Kubernetes monitoring tools that have been specifically designed for containerized environments.
#1. Kubernetes Dashboard
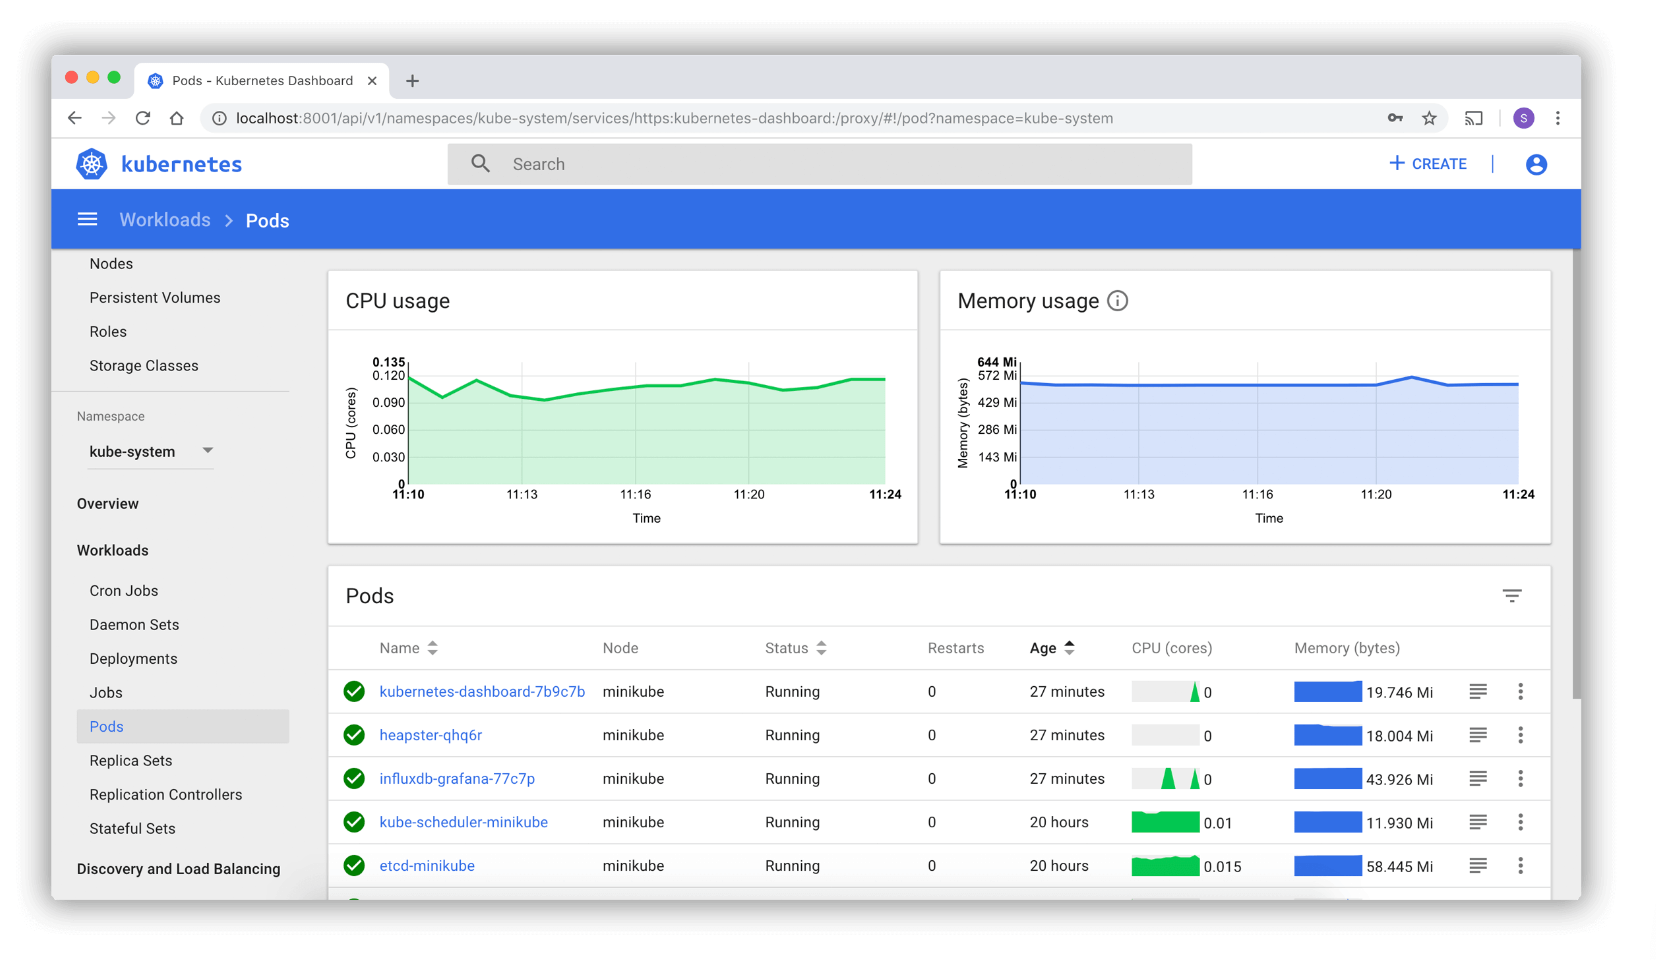 Kubernetes Dashboard for cluster monitoring. Source: komodor.com
The Kubernetes dashboard is good; however, only for basic Kubernetes monitoring, as it comes with some limitations. These include visibility to only specific metrics that aren't monitored in real-time, limited alerting, single cluster view, lack of historical data, and limited filtering options. Therefore, other dedicated Kubernetes monitoring tools can offer more advanced capabilities.
Best for: basic Kubernetes monitoring.
#2. Prometheus
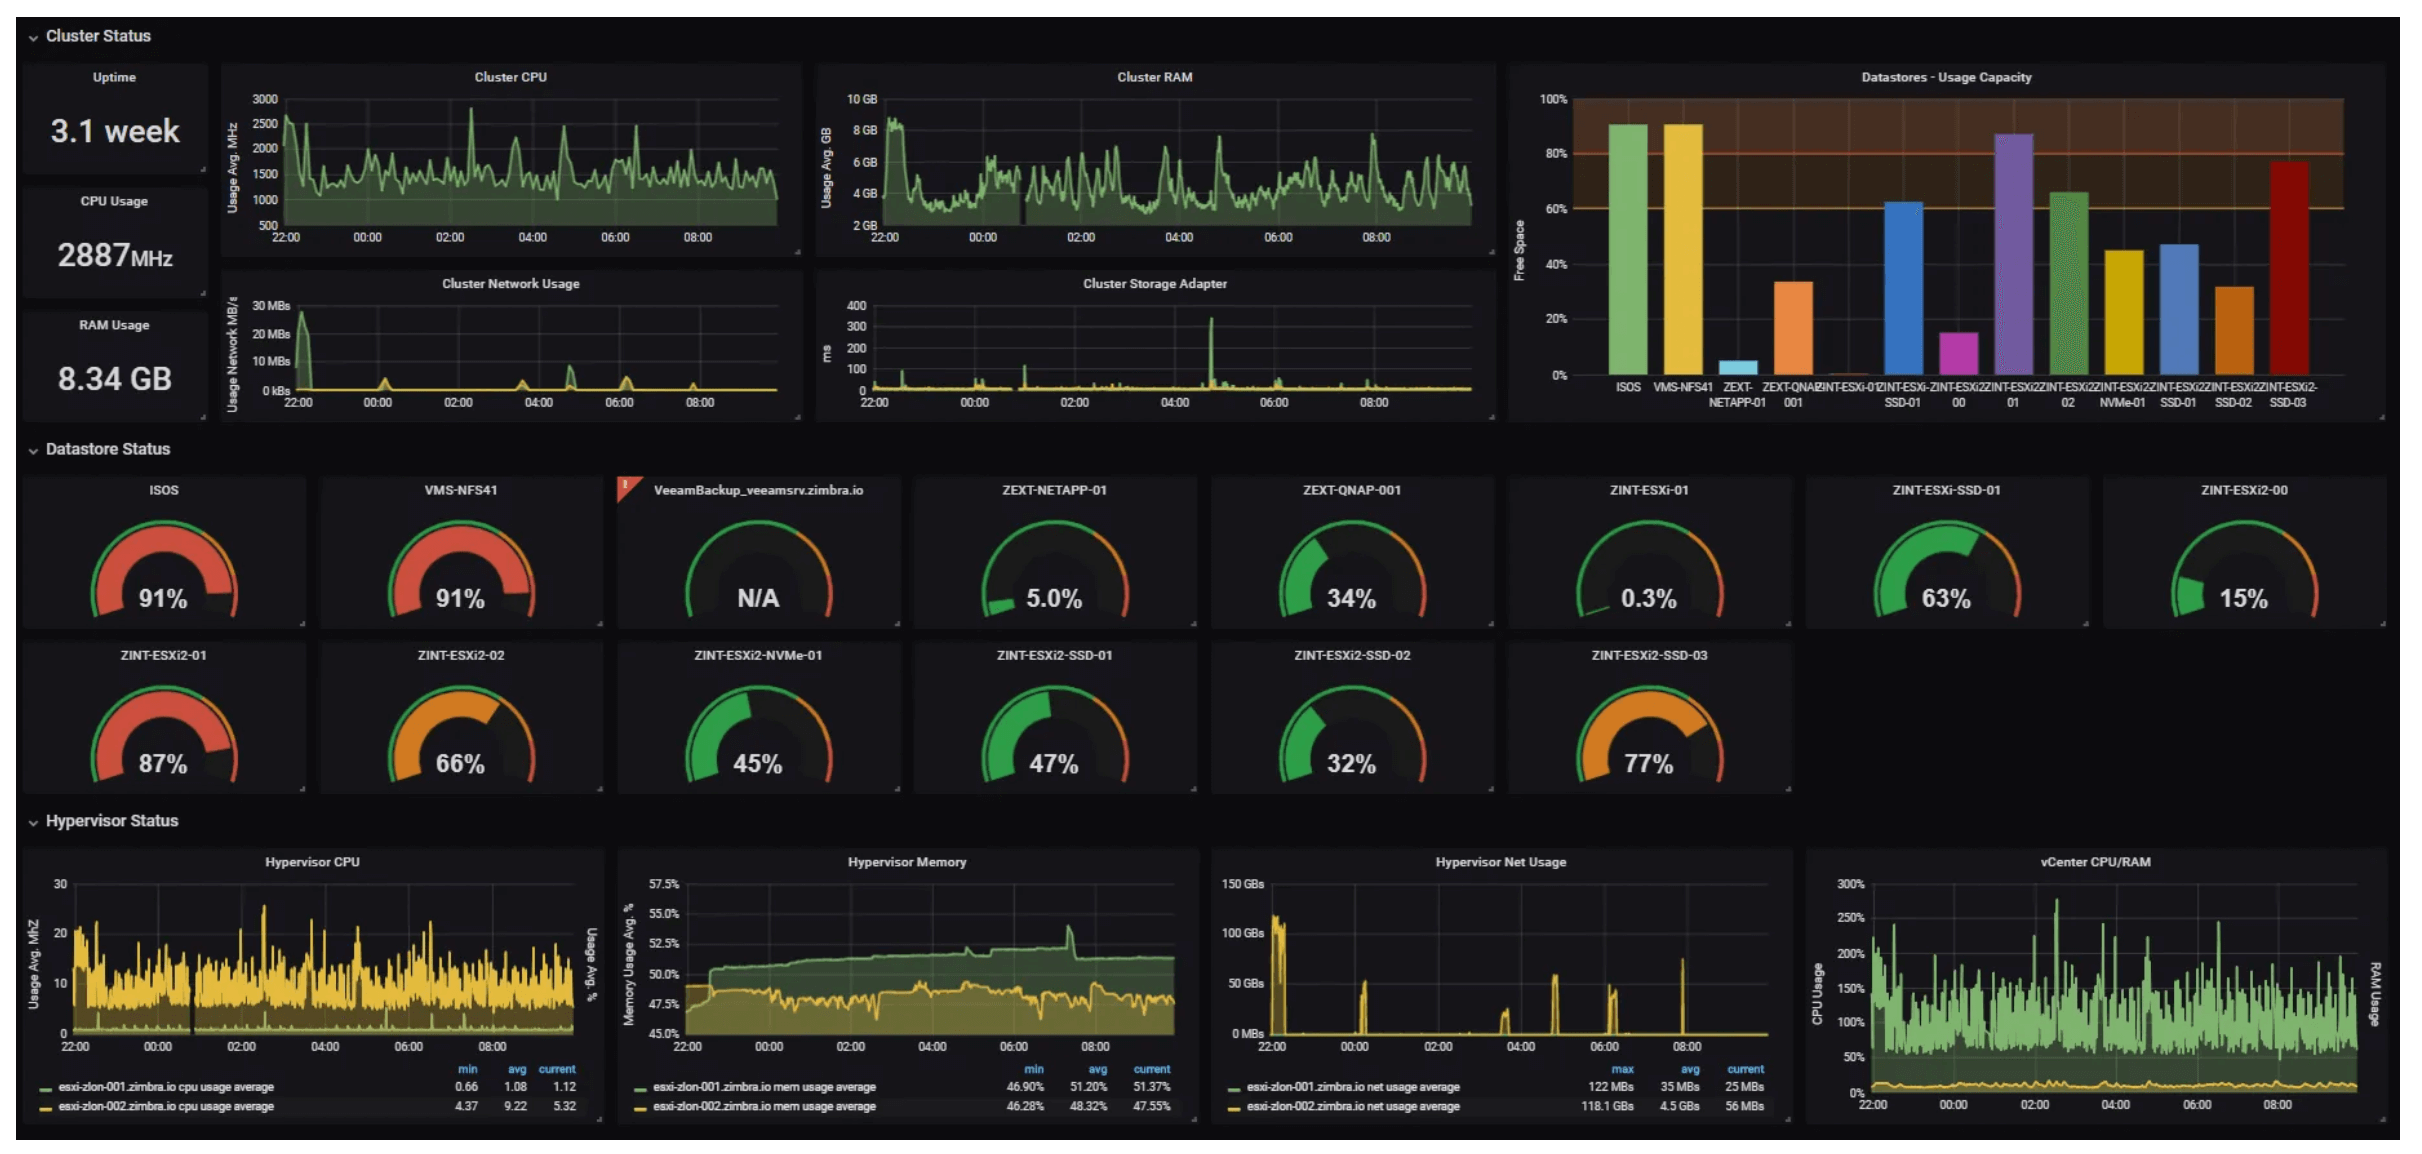 Kubernetes monitoring with Prometheus via Grafana. Source: sysdig.com
Prometheus is an open-source tool for monitoring and storing time-series data. It handles large datasets and long term storage of metrics. For advanced Kubernetes monitoring, Prometheus is one of the best tools to use, as it offers comprehensive metrics, is designed for high workloads, and is highly customizable. It also integrates with Grafana, a popular Kubernetes monitoring tool for dashboards and metrics visualization.
Best for: advanced Kubernetes monitoring (comprehensive metrics, customizable).
#3. Grafana
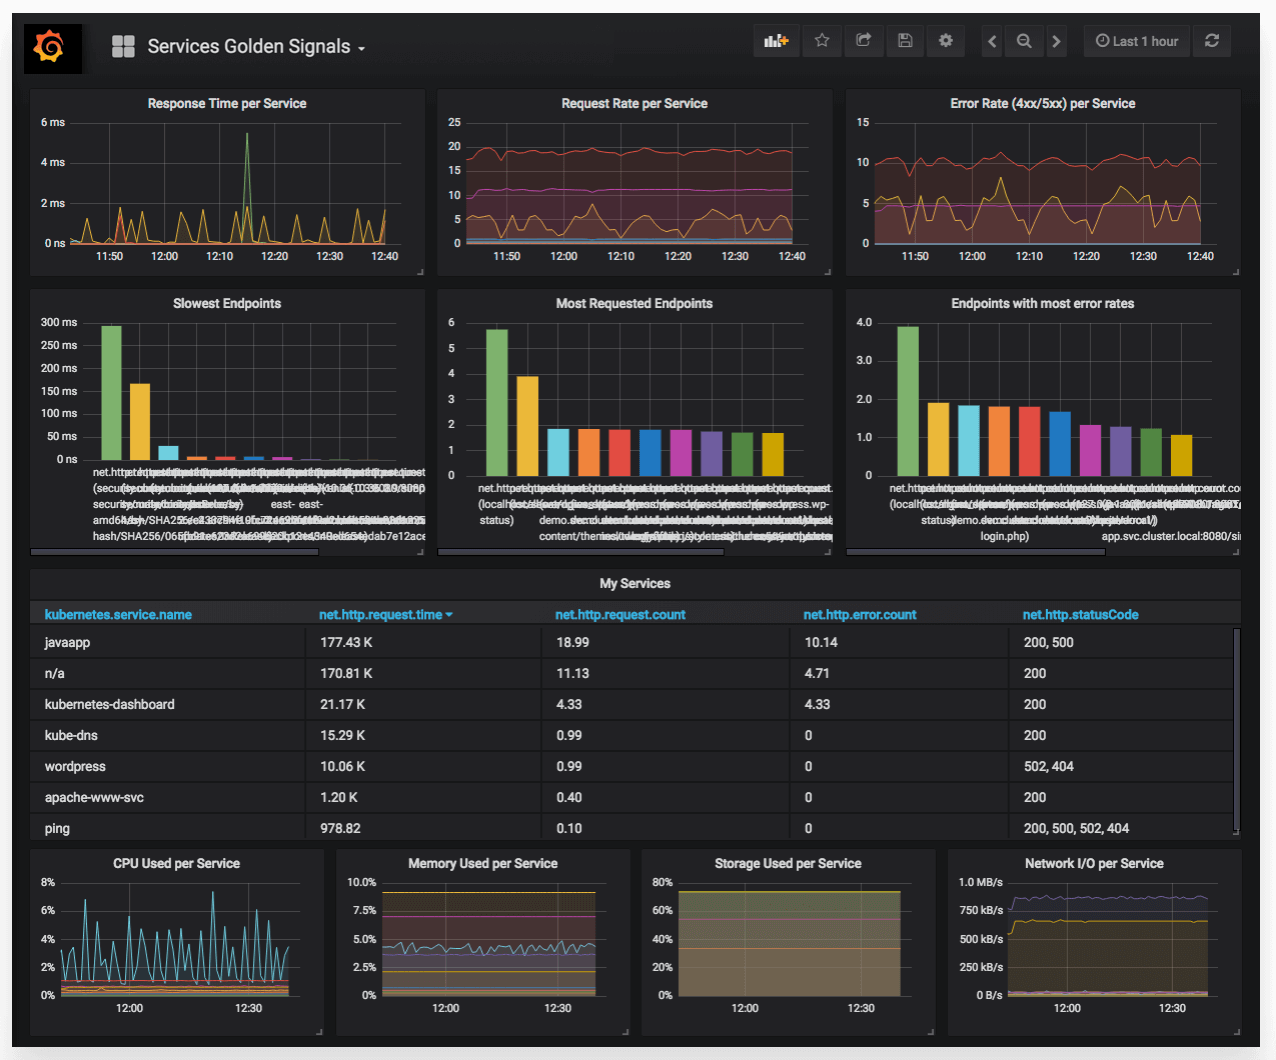 Grafana dashboard for Kubernetes monitoring. Source: commercetools.com
Grafana is an open-source platform for visualization of metrics and data. It provides four default dashboards for monitoring Kubernetes clusters: Cluster, Node, Pod/Container and Deployment. Kubernetes administrators can create customized dashboards in Grafana with rich visualizations using the metrics collected by Prometheus.
Best for: dashboards and metrics visualization.
#4. Datadog
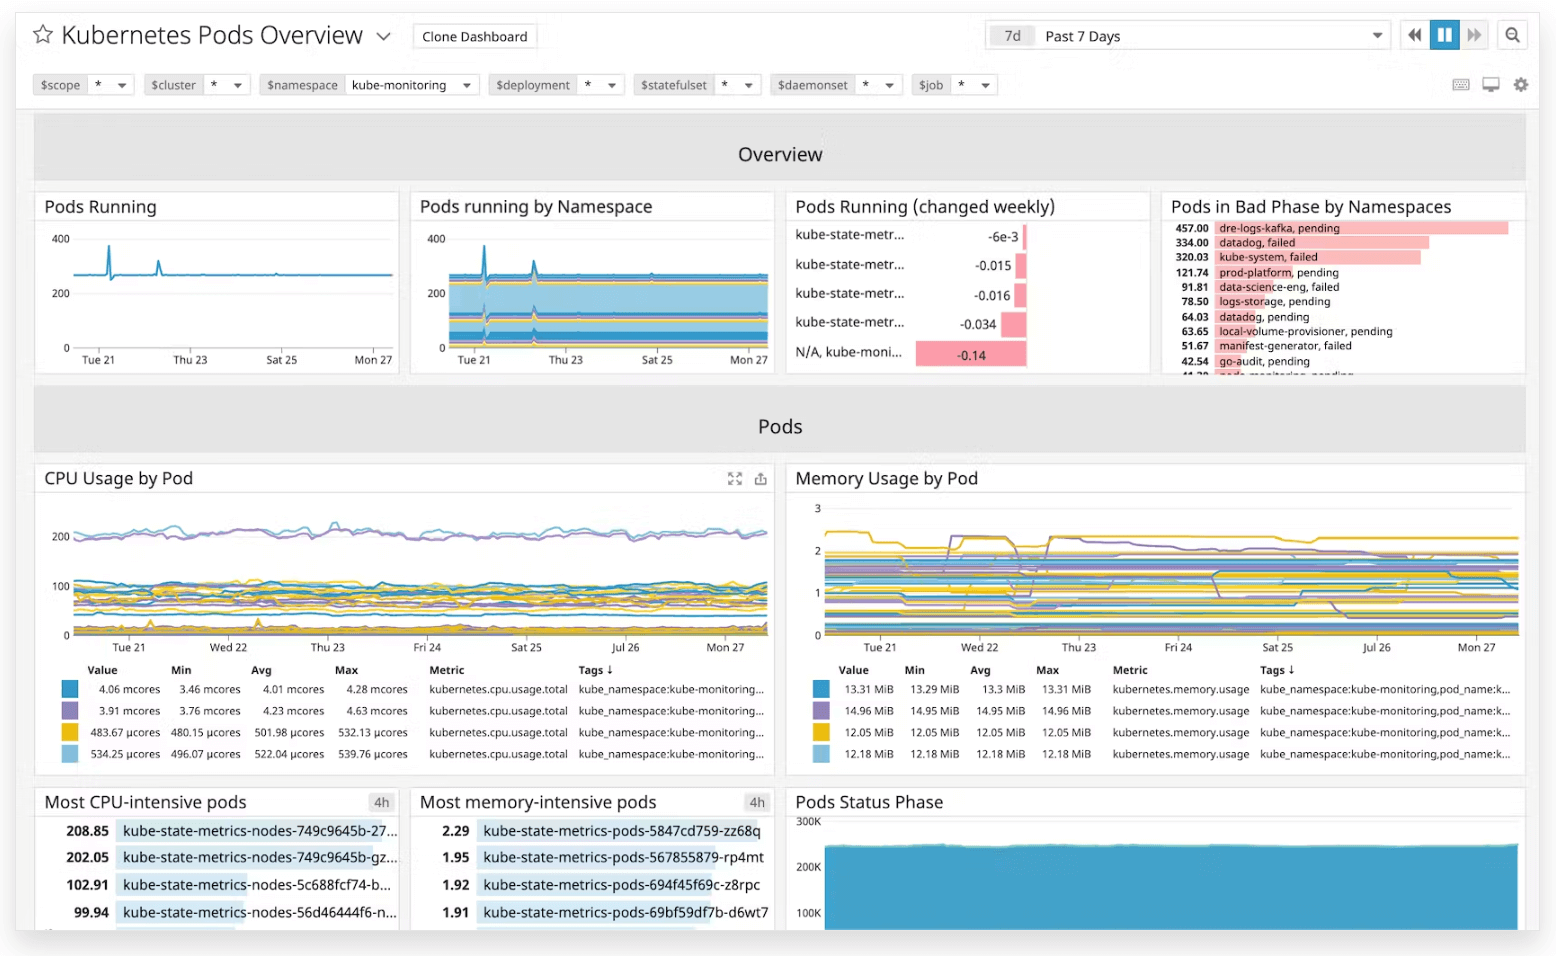 Datadog dashboard for Kubernetes monitoring. Source: datadoghq.com
Datadog is a comprehensive monitoring platform that helps you gain visibility into your hybrid infrastructure, containers, and applications. It provides one place to gain insights, troubleshoot issues and optimize performance. However, unlike Prometheus and Grafana, Datadog is a paid solution, and its pricing can be expensive. Once an organization invests in it, switching to other monitoring tools can be difficult.
Overall, Datadog supports multiple clusters and allows configuring metric collection via Kubernetes YAML annotations, making it a robust solution for advanced Kubernetes monitoring needs overall.
Best for: advanced Kubernetes monitoring (dashboards, rich insights).
#5. Sysdig Monitor
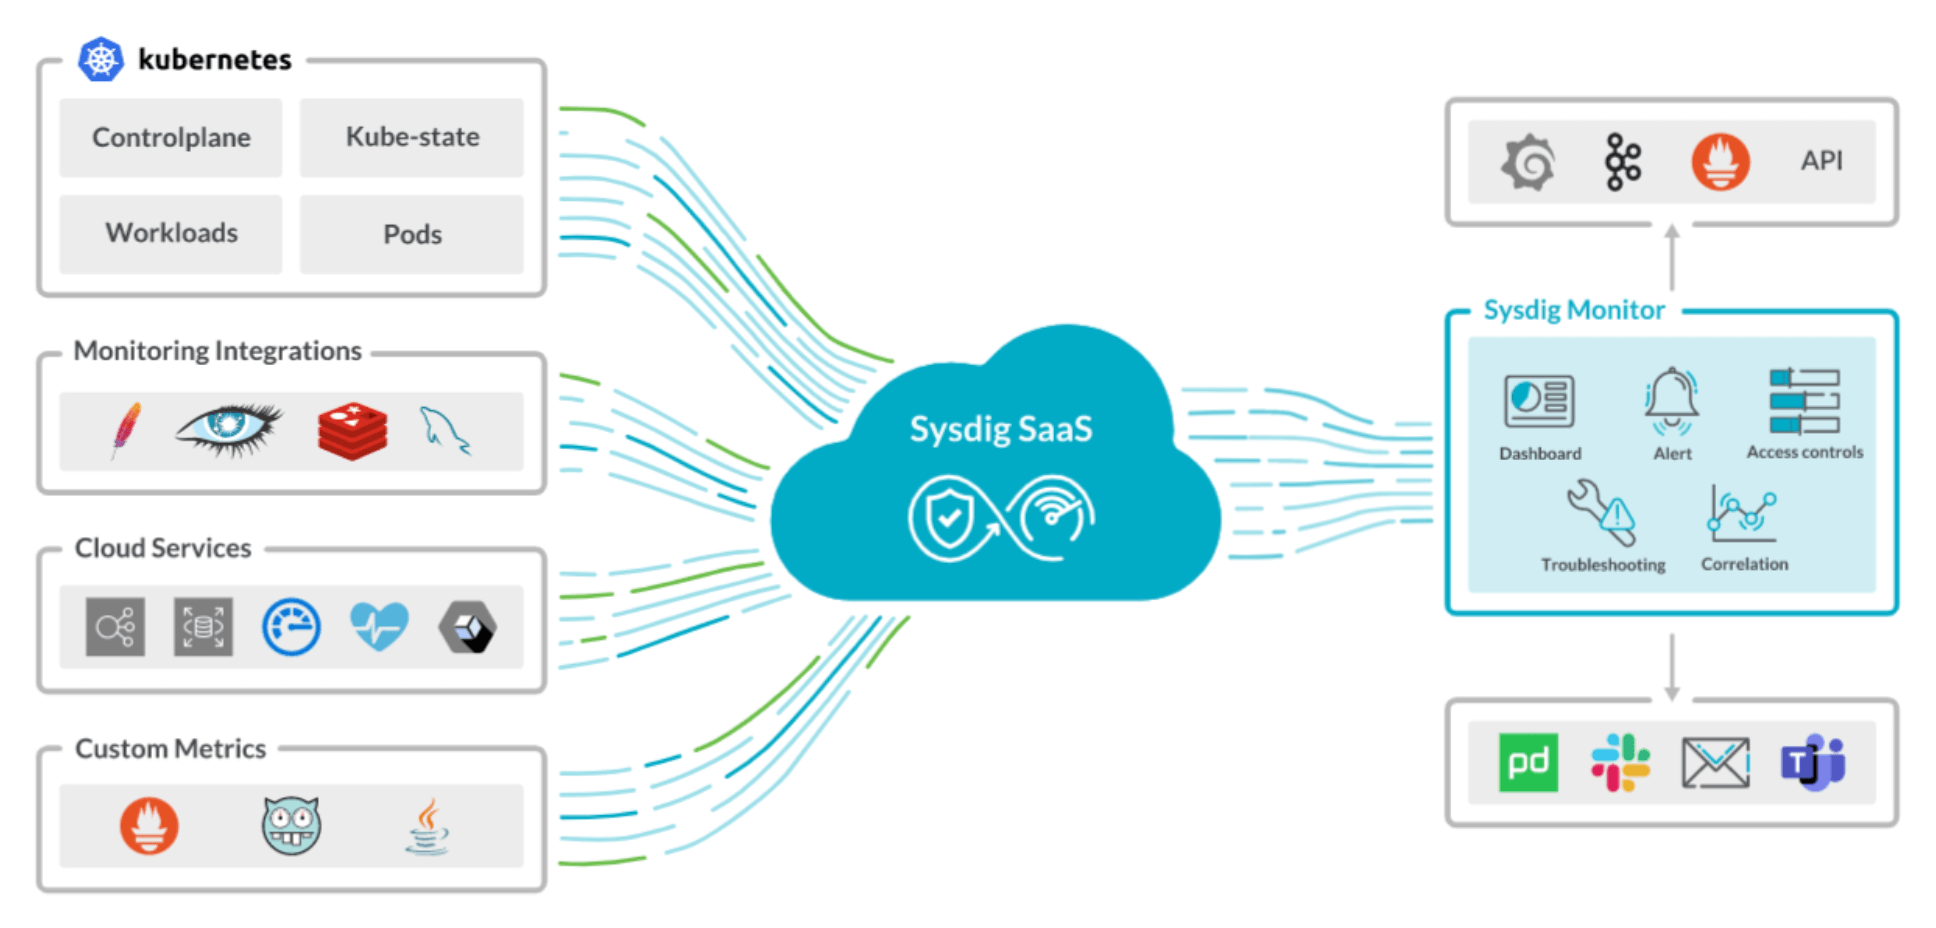 Sysdig Monitor tool overview. Source: sysdig.com
Sysdig Monitor is a comprehensive container monitoring platform that allows you to collect metrics, trace requests, manage logs, create alerts and troubleshoot issues for your containerized and Kubernetes environments. While Sysdig Monitor does have an open source version for basic functionality, this commercial tool also has a paid version required for advanced features.
Best for: troubleshooting features.
Also read: How to Create Kubernetes Namespaces
#Best practices for monitoring Kubernetes clusters
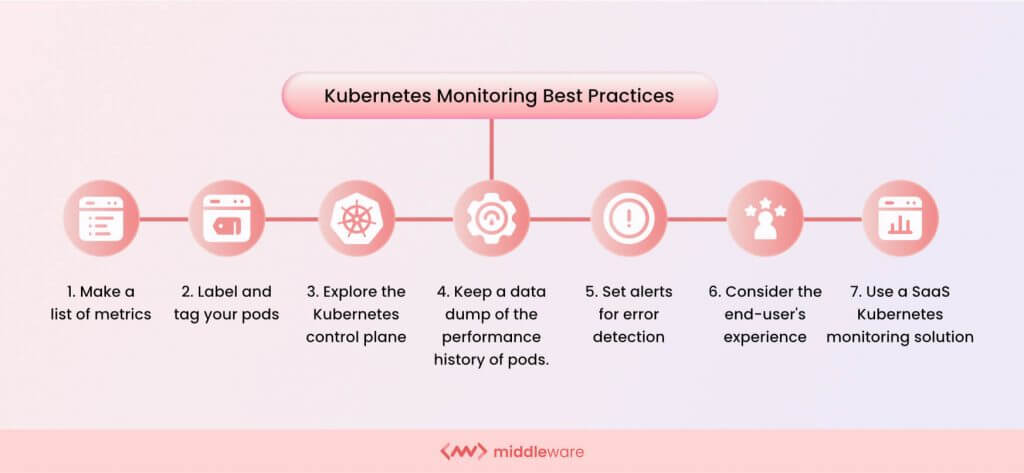 Kubernetes monitoring best practices. Source: middleware.io
Ready to master Kubernetes monitoring? This section unlocks a handful of best practices to help you track your cluster's health, streamline operations, and pre-empt issues.
#1. Identify key metrics
First, note down the vital metrics you plan on keeping tabs on. These could be your cluster nodes, pods, applications, or other related resources. Having these listed ensures you can monitor all critical components.
#2. Label and tag your pods
With the swarm of containers in Kubernetes, logical labeling and systematic tagging are crucial. Whether application-specific or location-based, effective tagging aids in seamless and comprehensive cluster filtering. It's all about organization!
#3. Inspect the Kubernetes control plane
Keep a check on your Kubernetes control plane to gain insights into cluster performances. This step can help you spot issues with your Kubernetes microservices. In short, it's like getting a panoramic view of your Kubernetes clusters.
#4. Keep resource usage in check
Be proactive about resource utilization, whether it's CPU, memory, or storage. Overuse or underuse can lead to problems like poor performance and wasted resources. Regular monitoring can help optimize resource allocation and efficiency.
#5. Maintain performance history
Keep track of your pods' past performances. It not only helps with root cause analysis when things go wrong but also lets you make informed decisions for future improvements. Plus, it's always handy for predicting future cluster performances.
#6. Customize alerts based on severity
Not all alerts are created equal. Distinguish between minor hiccups and major issues by customizing alert levels. It will help you prioritize responses, deal with significant problems promptly, and avoid alert fatigue.
#7. Monitor Kubernetes metrics from a single dashboard
Multiple metrics such as request rate, call errors, and latency can fast-track you to any degradation in your microservices application. That's where the 'single pane of glass' strategy comes into play. Managing a complex digital system from a single dashboard is a management strategy.
This unified dashboard displays all your critical metrics in one place. Imagine swapping the chaos of multiple tools and interfaces with one straightforward, easy-to-navigate interface. Check out the following dashboard by Middleware for node monitoring.
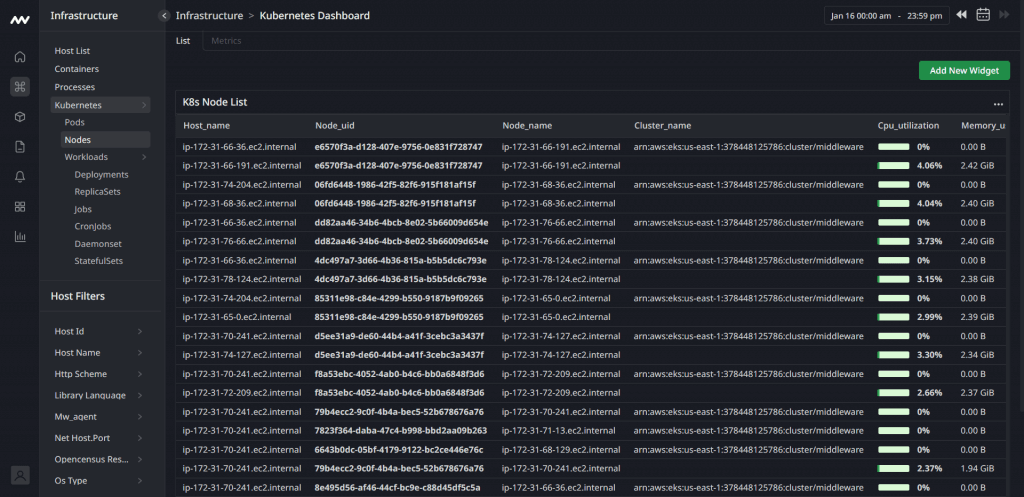 Middleware node monitoring dashboard. Source: middleware.io
It gives you a bird's eye view of your Kubernetes metrics - both at the pod and cluster level, simplifying and centralizing your monitoring process. The perks don't stop at just visual convenience.
Having all your data on one screen lets you spot trends, understand how different metrics interact, and track changes over time. It allows you to quickly identify and act on potential problems before they become full-blown issues.
#8. Ensure scalability and data retention capabilities
Scalability in monitoring systems is just as crucial as in your Kubernetes clusters. Imagine running a successful online retail store. As it grows and attracts more visitors (like your expanding Kubernetes cluster), the customer data generated increases. If your monitoring system can't scale, it may buckle under this data influx, failing to deliver accurate insights.
Similarly, sufficient data retention is like keeping records of your store's sales over time. It helps you troubleshoot issues (like why sales dipped last month) and spot trends (like the holiday season bringing more customers).
Plus, it's often a must for regulatory compliance, much like GDPR in the data world. So, ensuring scalability and data retention is a win-win for effective Kubernetes monitoring.
It's also important to consider security when monitoring Kubernetes. It involves implementing robust access control solutions, ensuring encrypted data transmission, isolating monitoring components from the core cluster, regularly updating and patching monitoring tools, enabling audit logs, and monitoring access patterns to detect and prevent potential threats.
#9. Set up alerts for critical metrics
Timely alerts are the watchtowers of your Kubernetes clusters. Setting up alerts for critical metrics like CPU or memory usage gives you a heads-up when hitting thresholds, enabling you to act before things get out of hand. It's like your car flashing a 'low fuel' light before the tank runs dry, giving you time to refuel.
Equally important is to channel these alerts to the right people. By directing alerts to relevant teams, issues get resolved faster, keeping your Kubernetes clusters in tip-top shape.
#Wrapping up
An effective Kubernetes monitoring strategy empowers you to optimize, innovate, and scale seamlessly, turning challenges into opportunities for growth. Applying these best practices means you're not just maintaining your clusters but laying the foundation for a resilient, scalable, high-performing digital future-proof infrastructure.
Thanks for learning with Cherry Servers! Our open cloud infrastructure gives developers full control, stable workloads, and free technical support 24/7.
Cherry Servers spot servers are a perfect match for containerized workloads to create self-managed Kubernetes clusters and run your worker nodes. Configure your infrastructure automatically via APIs, libraries, CLI tools, and DevOps integrations.