How to check CPU, Memory, and Disk Usage in Linux


Reviewing your system's resource usage offers multiple benefits. It allows you to monitor the server's health and resolve any issues as they arise. It also helps in capacity planning by showing you what resources you need to scale up to meet future demands.
Let’s check out how to monitor key system metrics, specifically CPU, memory, and disk usage.
#How to check CPU, Memory, and Disk Usage in Linux
This guide adopts two approaches. First, we will explore native CLI tools, and then delve into some third-party tools that aggregate metrics on a neat and comprehensive dashboard in your terminal.
#How to check CPU Usage in Linux
Here are some of the tools for checking your CPU's health.
#top command
Used as the primary process viewer in most Linux systems, the top command requires little introduction. It's a native CLI tool that prints dynamic, real-time processes. Additionally, it displays metrics such as load average, CPU, and memory consumption.
top
Locate the third row. This is where the CPU metrics are presented.
Output%Cpu(s): 7.8 us, 0.2 sy, 0.0 ni, 92.0 id, 0.0 wa, 0.0 hi, 0.0 si, 0.0 st
us: This is short for 'user.' This is the time spent running user applications.
sy: This is short for 'system.' It represents the time consumed in running system and kernel processes.
ni: Short for 'nice'. This shows the time spent on processes with a manually configured nice priority.
id: Short for 'idle'. The time the CPU was idle.
wa: Short for 'iowait'. This indicates time spent waiting for I/O operations.
hi: Short for 'hardware interrupts'. Time spent servicing hardware interrupts.
si: Short for 'software interrupts'. Time spent servicing software interrupts.
st: Stands for 'Steal time'. This is an attribute seen in cloud/VMs. This is time stolen by the hypervisor for other VMs.
Consider the following output:
Output%Cpu(s): 18.0 us, 7.0 sy, 0.0 ni, 75.0 id, 0.0 wa, 0.0 hi, 0.0 si, 0.0 st
Here's the interpretation:
User processes are consuming 18% of the CPU.
The kernel and system processes are using 7% of the CPU.
About 75% of the CPU is idle.
You can press 1 to view CPU statistics for each CPU core.
Press q to quit the top command usage statistics and revert to your terminal shell.
#htop command
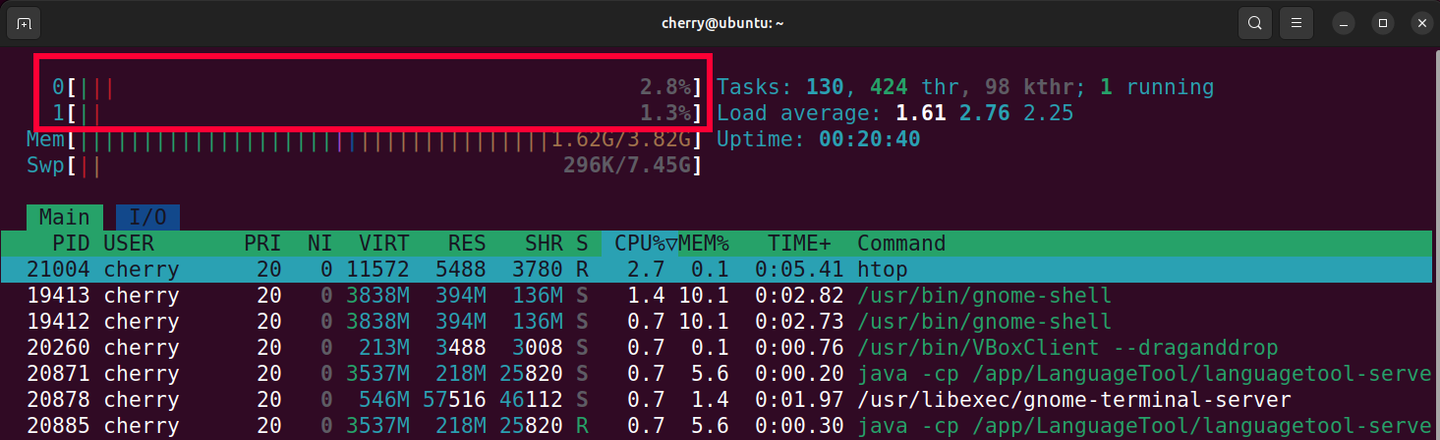
Htop is an improved and sleeker alternative to the classic top command. Its neat UI and color-coded values make it easy to spot and interpret system processes and metrics. CPU and memory statistics appear in the upper left section, represented by color-coded status bars. Right next to the bars, you get dynamic values of CPU usage in a human-readable format.
In the output shown, the system has two CPU cores: CPU cores 0 and 1, with 2.8% and 1.3% usage, respectively.
#vmstat command
The vmstat command provides the inside scoop on key system information. It prints out real-time system info on block I/O, memory usage, paging, and CPU usage.
Without any command-line options, it provides the following information.
vmstat
Outputprocs -----------memory---------- ---swap-- -----io---- -system-- -------cpu-------
 r  b   swpd   free   buff  cache   si   so    bi    bo   in   cs us sy id wa st gu
 1  0     0  542420  52180 1263808   0    0     1    25   42   0  0  0 100  0  0  0
The CPU information is displayed at the extreme right. These are percentages of total CPU time.
us: The percentage of CPU time spent running user applications and programs.
sy: The percentage of CPU time allocated to running kernel processes.
id: The percentage of CPU idle time.
wa: The percentage of CPU time waiting for disk and network I/O.
st: The percentage of CPU time 'stolen' or taken up by a hypervisor (only in VMs and cloud servers).
Suppose you have the following output:
Outputus  sy id  wa  st gu
15  5  70  10  0  0
Here’s the interpretation of the output:
15% - user processes
5% - kernel/system
70% - idle CPU
10% - waiting on I/O
The idle CPU value is the parameter that indicates your CPU health. The greater the value, the less the CPU usage, and vice versa. This also implies your CPU has ample processing power to take on additional workload. In the output, the Idle CPU % in this case is 70%, implying CPU usage is at 30%. This indicates the CPU has plenty of room to accommodate more applications/services.
#iostat command
The iostat command is yet another CLI tool you can leverage to monitor your CPU performance. It displays CPU utilization statistics by default, alongside disk I/O performance. Without any command-line arguments, it prints out the following output.
iostat
The avg-cpu section offers the CPU usage information.
OutputLinux 6.8.0-90-generic (legible-husky)  02/17/26        _x86_64_        (2 CPU)

avg-cpu:  %user   %nice   %system	 %iowait    %steal    %idle
          0.11     0.01     0.07      0.01       0.00     99.79

Device    tps    kB_read/s    kB_wrtn/s    kB_dscd/s    kB_read    kB_wrtn    kB_dscd
loop0    0.00      0.00        0.00      	 0.00          14        0   	     0
sr0      0.00      0.00        0.00        	 0.00          312       0     	     0
vda      2.41      1.86        25.93      	 0.00         440167    6144726      0
To display only CPU statistics, pass the -c flag:
iostat -c
OutputLinux 6.8.0-71-generic (localhost) 	02/12/2026 	_x86_64_ 	(2 CPU)

avg-cpu:  %user   %nice    %system %iowait  %steal   %idle
          1.02    0.01      0.11    0.01    0.00     98.85
Here’s a brief description of the CPU percentage labels:
%user: This is the percentage of CPU used by user processes.
%nice: The percentage of CPU consumed by user processes with nice priorities.
%system: The percentage of CPU consumed by the kernel.
%iowait: The percentage of time the CPU is idle as it waits for I/O to complete.
%idle: The percentage of time the CPU is idle.
#How to check memory Usage in Linux
Memory monitoring enables users to detect which applications consume excessive amounts of their available memory. It also enables capacity planning by allowing you to schedule memory upgrades before end users experience performance lags.
#free command
The easiest way to display memory usage is to leverage the free command. By default, it presents this information in kilobytes.
free
The -h option formats the output in a more human-readable format.
free -h
Consider the following output.
Output                total        used        free       shared    buff/cache   available
Mem:           3.8Gi       1.1Gi       689Mi       592Ki       2.3Gi        2.7Gi
Swap:          495Mi       768Ki       495Mi
Let’s break the output down:
total: This represents the total memory. Here, the physical memory is approximately 4GB RAM, while the swap is nearly 500 MB
used: The memory currently in use.
free: The untouched or unused memory.
buff/cache: The memory used by OS cache/buffers.
Available: This indicates memory that is free and ready to be used by applications.
Your primary focus should be on the available memory. This is your system’s real indicator of memory health. A higher value implies you have plenty of memory at your disposal to run additional applications. A low value indicates you are running low on memory and should consider ending some applications.
#top and htop commands
We've previously examined the top and htop tools and their roles in checking CPU statistics. What's also apparent is their versatility in displaying other metrics, including both physical and swap usage.
For example, the top command displays the memory usage statistics in the last two rows of the upper metrics section.
OutputMiB Mem :   3916.0 total,    651.4 free,   1156.3 used,   2395.1 buff/cache
MiB Swap:    496.0 total,    495.2 free,      0.8 used.   2759.6 avail Mem
Meanwhile, htop presents the usage statistics in progress bars, just as it does when displaying CPU usage.
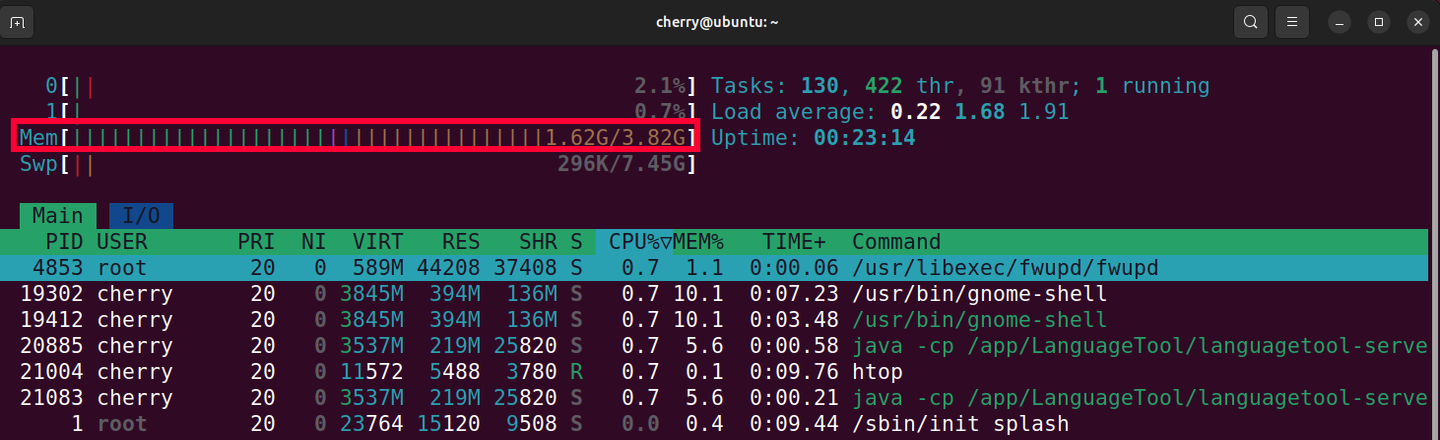
Let’s break down the color codes:
Green: This is memory currently in use by the system. Blue: The memory used by buffers. Yellow/Orange: The memory used by cache.
#How to check disk usage in Linux
Let's explore some of the tools you can use to check disk usage.
#df command
The df command, short for disk free, displays the amount of used and available disk space on mounted file systems. Without command-line options, it prints the following output:
df
The -Th presents the disk statistics in a human-readable format, making it easier to interpret the values displayed.
df -Th
OutputFilesystem      Type      Size  	Used 	Avail	 Use% 	 Mounted on
tmpfs           tmpfs     392M 	    1008K   391M     1% 	 /run
/dev/sda        ext4       79G  	6.1G   	69G	     9% 	 /
tmpfs           tmpfs     2.0G    	  0 	2.0G 	 0%	     /dev/shm
tmpfs           tmpfs     5.0M   	  0 	5.0M 	 0%	     /run/lock
tmpfs           tmpfs     392M   	12K	    392M     1% 	 /run/user/0
The root partition mustn't get filled up, as it may result in non-responsive programs and, worse, a system freeze.
You should also consider high usage in other partitions as well. This could also indicate problems in selected data and user files.
#du command (disk usage)
The du command calculates the amount of space taken by files and directories. Without any arguments, it displays the disk usage of your current directory (including all files and subdirectories).
du
Sample output
Output8	./.local/share/gnome-shell
4	./.local/share/sounds
4	./.local/share/flatpak/db
8	./.local/share/flatpak
4	./.local/share/ibus-table
4	./.local/share/applications
620	./.local/share
624	./.local
4	./Videos
732064	.
Pass the -h option to present the values in a human-readable format.
du -h
Output8.0K	./.local/share/gnome-shell
4.0K	./.local/share/sounds
4.0K	./.local/share/flatpak/db
8.0K	./.local/share/flatpak
4.0K	./.local/share/ibus-table
4.0K	./.local/share/applications
620K	./.local/share
624K	./.local
4.0K	./Videos
715M
To view disk usage for a different directory, specify the directory path. This example shows the disk usage for the Downloads directory.
du -h /home/cherry/Downloads
Output78M /home/cherry/Downloads
The -a option displays the files contained in the subdirectories and their individual disk usage.
du -ah /home/cherry/Downloads
Output25M	/home/cherry/Downloads/wordpress.zip
28M	/home/cherry/Downloads/Python-3.13.0.tgz
25M	/home/cherry/Downloads/latest.zip
78M	/home/cherry/Downloads
To view the total disk usage summary of a directory without displaying the directory contents, simply pass the -s option. The following command will give you the total disk usage summary only.
du -sh
Output715M .
#Checking CPU, memory, and disk statistics using third-party CLI tools
In addition to the command-line tools we have discussed, there are free and open-source third-party tools that can offer an even better user experience. Here, we look at some popular all-in-one CLI monitoring tools.
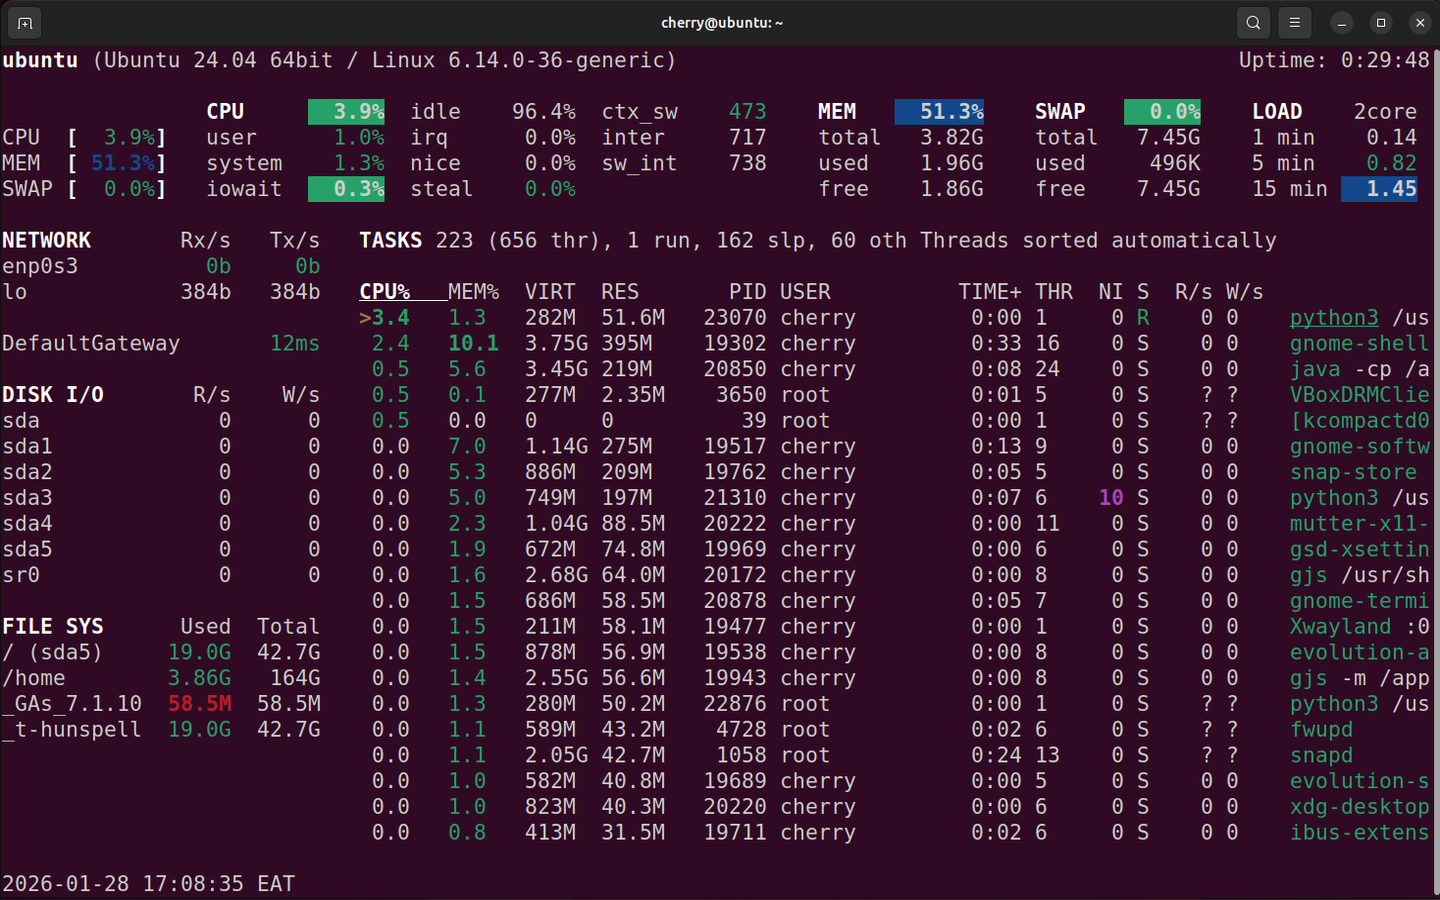
#Glances
This is a full-featured, terminal-based program used to display system parameters, such as memory, CPU, uptime, disk I/O, and running processes. It displays system metrics on a neat, terminal dashboard with color-coded labels for various metrics. When installed on bare metal systems, it extends its functionality by displaying CPU core temperatures, fan speed, and other parameters not available on virtual/cloud servers.
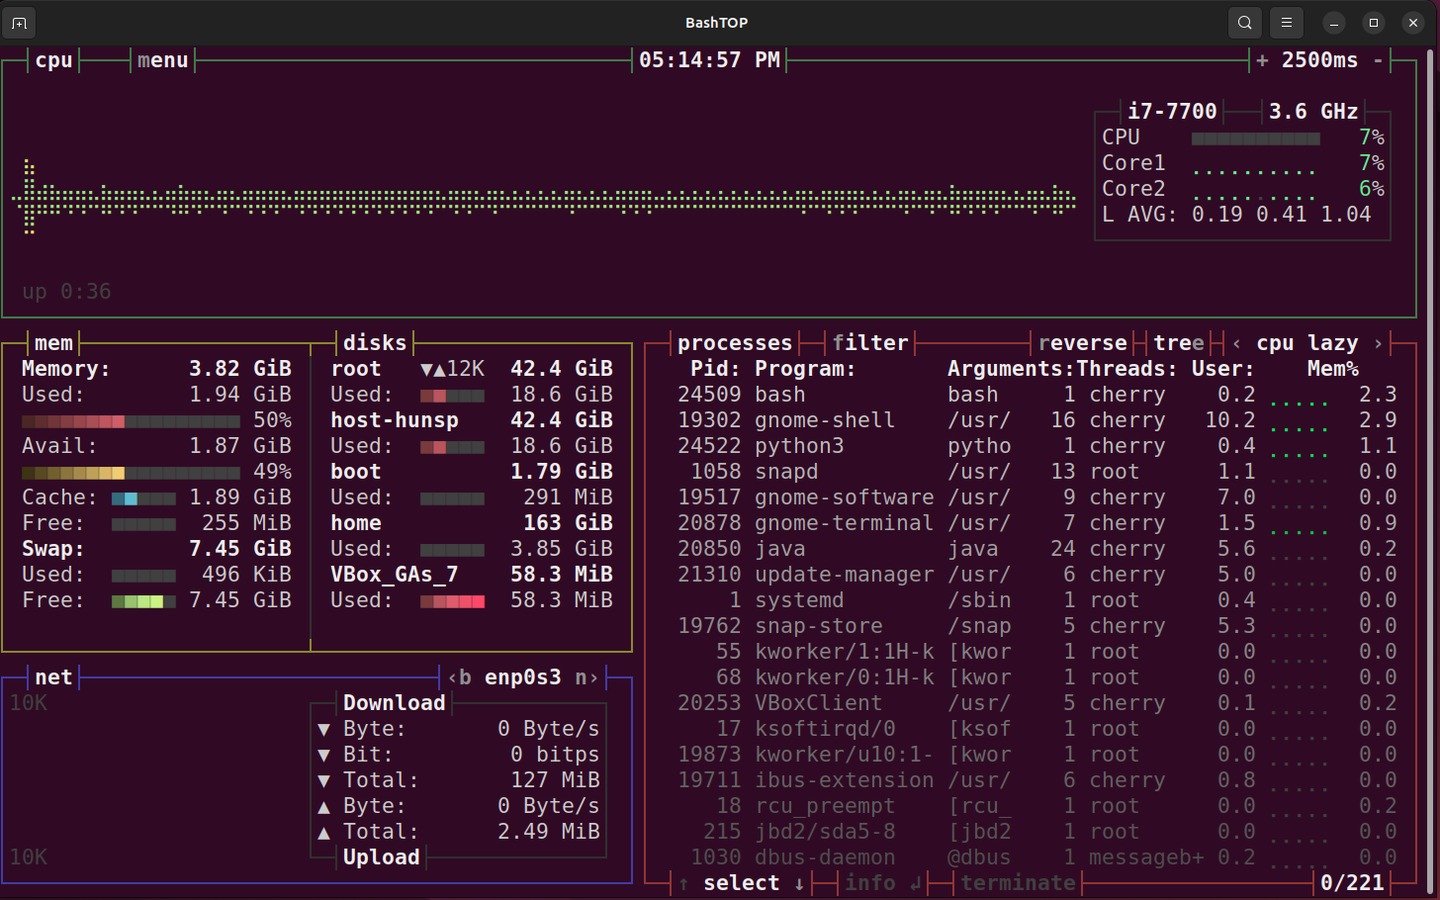
#Bashtop
Bashtop is a versatile and all-round terminal-based monitoring tool that excels in more ways than just being a process viewer. At first glance, one is immediately drawn in by its elegant, game-like user interface. Bashtop uses a color-coded, game-inspired terminal UI with bordered sections that separate CPU, memory, disk, network, and process metrics at a glance.
At the top, a real-time CPU usage graph is displayed, alongside several statistics, including CPU speed, the number of CPU cores, and the load average. Memory and disk usage statistics are shown in color-coded data bars, with figures presented in a human-readable format. The network section also features a dedicated section with a colored bandwidth usage graph, displaying download/upload metrics.
Other closely related monitoring tools include btop++, bytop, and btop.
#Summing up
Resource usage monitoring is essential in assessing system health and ensuring optimal performance. It's usually one of the routine tasks in administration that allows you to catch suspicious behavior and identify the root cause. Checking system usage metrics also helps in capacity planning, as it lets you schedule additional resources to support future workloads.