Server Monitoring with Prometheus and Grafana


Server monitoring provides visibility into your IT environment. It enables you to track hardware and application metrics, as well as analyze trends over time. Monitoring is typically two-fold: hardware and application monitoring.
Hardware monitoring involves monitoring statistics like CPU and memory usage, filesystem health, disk I/O, uptime, and network bandwidth. Equally crucial is being able to observe your servers' security status. This calls for vulnerability assessments, malware detection, and monitoring failed login attempts, which can signal potential brute-force attacks.
Application monitoring takes a more granular approach. Diverse metrics are derived to provide insights into an application's performance and health. For a web server, you might want to gather metrics such as response times and HTTP status codes. The information gathered helps you improve performance.
#What is Prometheus?
A CNCF project, Prometheus is a widely used server monitoring tool ideal for graphing and storing time-series metrics. It offers powerful querying capabilities, thanks to PromQL, which filters and aggregates data in real time. Prometheus is versatile and flexible, making it a good fit for monitoring both traditional on-premise and cloud-native environments. It's a household name in Kubernetes and is used to monitor microservices.
A notable drawback of Prometheus is its limited dashboarding capabilities. It offers a basic graphing interface for ad hoc debugging, which is not intuitive or easy to use to gain valuable insights. That brings us to the next monitoring solution.
#What is Grafana?
Grafana is a powerful & customizable dashboarding tool that transforms time-series metrics into stunning visualizations by way of charts and graphs. It aims to offer better visualization of metrics from connected data sources, which provide limited visualization capabilities. Beyond visualization, it provides powerful alerting capabilities, which send alerts to notify users when certain thresholds are exceeded.
#Prerequisites
We will configure Prometheus and Grafana on a single server. This will be sufficient to showcase how the two monitoring solutions interact. Ubuntu 24.04 will be our preferred environment.
So, ensure you have the following:
An instance of Ubuntu 24.04 with SSH access and a sudo user configured.
Prometheus and Grafana are already installed on your server instance. If not, check out how to install Prometheus and how to insall Grafana on Ubuntu.
#Step 1: Install Prometheus Node Exporter
The first step is to install the Node Exporter client. It runs on the server to retrieve server-specific metrics. The metrics are scraped and stored, upon which Grafana takes over and visualizes them.
So, download the latest binary release of Node Exporter.
wget https://github.com/prometheus/node_exporter/releases/download/v1.9.1/node_exporter-1.9.1.linux-amd64.tar.gz
With the Node Exporter downloaded, untar it to extract its contents into a folder.
tar -xvf node_exporter-*.tar.gz
The extraction creates a directory named node_exporter-1.9.1.linux-amd64. This contains a folder called node_exporter and a few other files. You can preview the directory contents by running the command:
ls -l node_exporter-1.9.1.linux-amd64
Outputtotal 21700
-rw-r--r-- 1	 cherry cherry        11357	 Apr 	 1 	18:23 		LICENSE
-rw-r--r-- 1  	 cherry cherry             463          Apr 	 1 	18:23		 NOTICE
-rwxr-xr-x 1 	 cherry cherry  22204245	 Apr 	 1 	18:19		 node_exporter
You must move the node_exporter folder to the usr/local/bin location. To do so, run the command:
sudo mv node_exporter-1.9.1.linux-amd64/node_exporter /usr/local/bin
Next, create a systemd service for Node exporter. First, create a system user.
sudo useradd -rs /bin/false node_exporter
With the Node Exporter system user in place, create a systemd file.
sudo vim /etc/systemd/system/node_exporter.service
Add the following lines.
[Unit]
Description=Node Exporter
Wants=network-online.target
After=network-online.target


[Service]
User=node_exporter
Group=node_exporter
Type=simple
Restart=on-failure
RestartSec=5s
ExecStart=/usr/local/bin/node_exporter

[Install]
WantedBy=multi-user.target
Save the changes and exit the text editor.
Next, reload the systemd manager configuration.
sudo systemctl daemon-reload
Start the Node Exporter service.
sudo systemctl start node_exporter
You can enable the service as follows.
sudo systemctl enable node_exporter
To confirm Node Exporter is up, run:
sudo systemctl status node_exporter
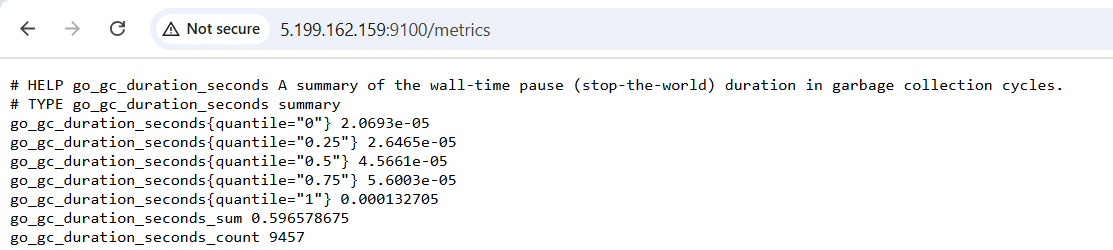
The Node Exporter service listens on TCP port 9100. Verify this by running:
ss -pnltu | grep 9100
Visit http://server-ip:9100/metrics to view the raw statistics in plain text.
#Step 2: Configure Prometheus to monitor remote nodes
You need to make a few changes for Prometheus to start scraping server metrics. Therefore, access the YAML file.
sudo vim /etc/prometheus/prometheus.yml
By default, Prometheus includes a single job called 'prometheus' in the scrape_configs section. Below that, you'll see the following lines.
 static_configs:
 - targets: ["localhost:9090"]
This section defines the endpoint. The line targets: ["localhost:9090"] specifies the target system or endpoint, in this case, the local server on port 9090. Prometheus by default listens on this port.
Directly below, create another job by adding the following lines as shown.
- job_name: "remote-node"
  static_configs:
    - targets: ["localhost:9100"]
We have created a job called remote-node. Node Exporter will scrape metrics on localhost on port 9100.
Then restart Prometheus for the changes to take effect.
sudo systemctl restart prometheus
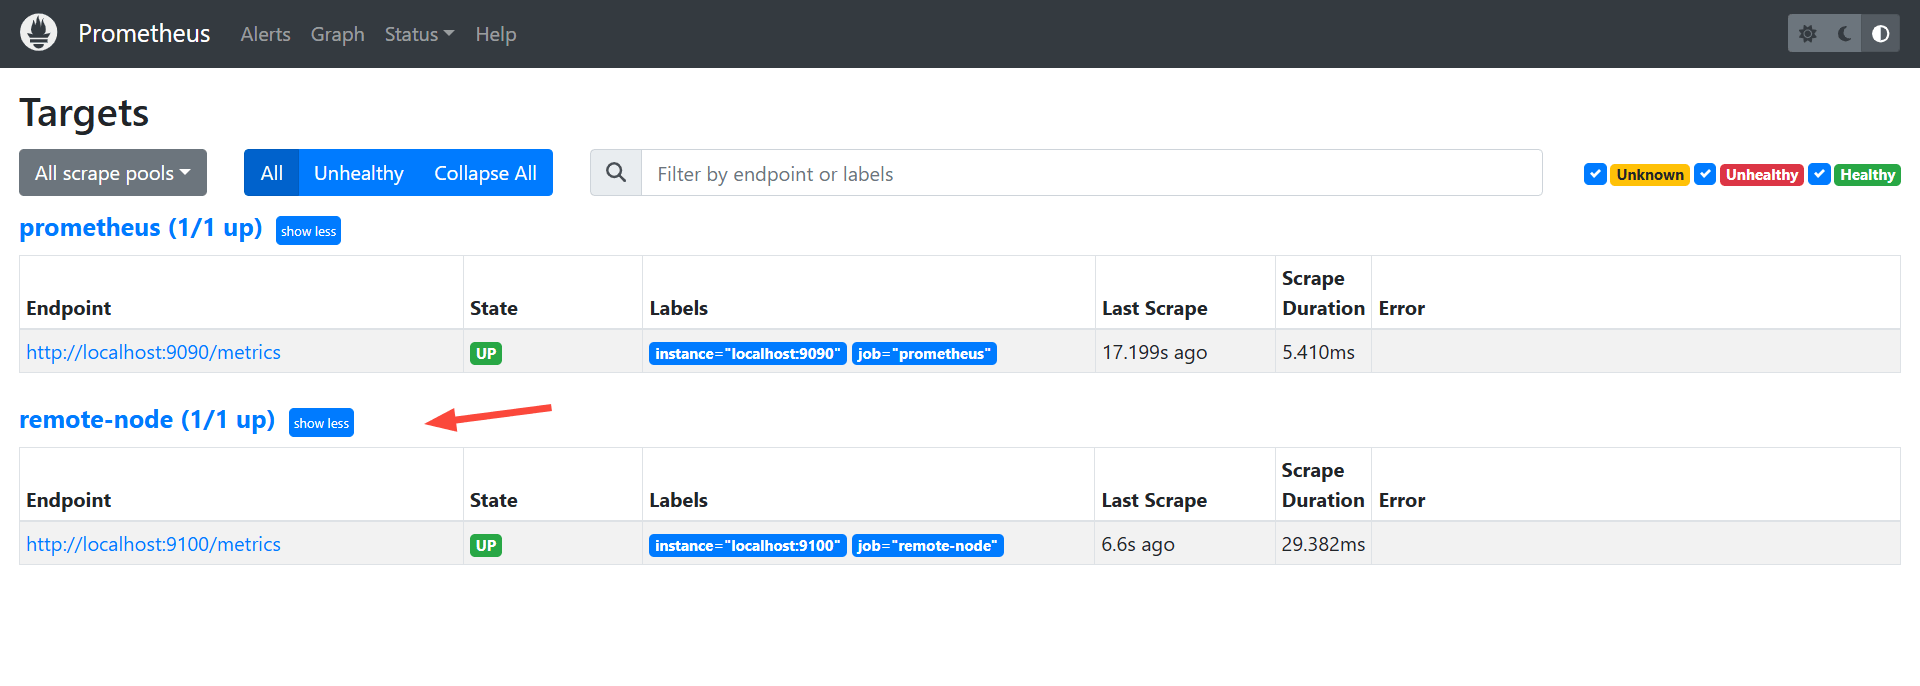
Afterward, visit http//server-ip:9090. Head to Status > Targets. And there, an endpoint named "remote-node" will be displayed. Click the show more blue button beside the remote-node (1/1 up) target to reveal more information about the endpoint, which is our server instance.
#Integrating Prometheus with Grafana
The next course of action is to visualize the metrics with Grafana. However, integration with Prometheus as a data source is mandatory for this to happen. So, follow the outlined steps.
#Add Prometheus as a data source
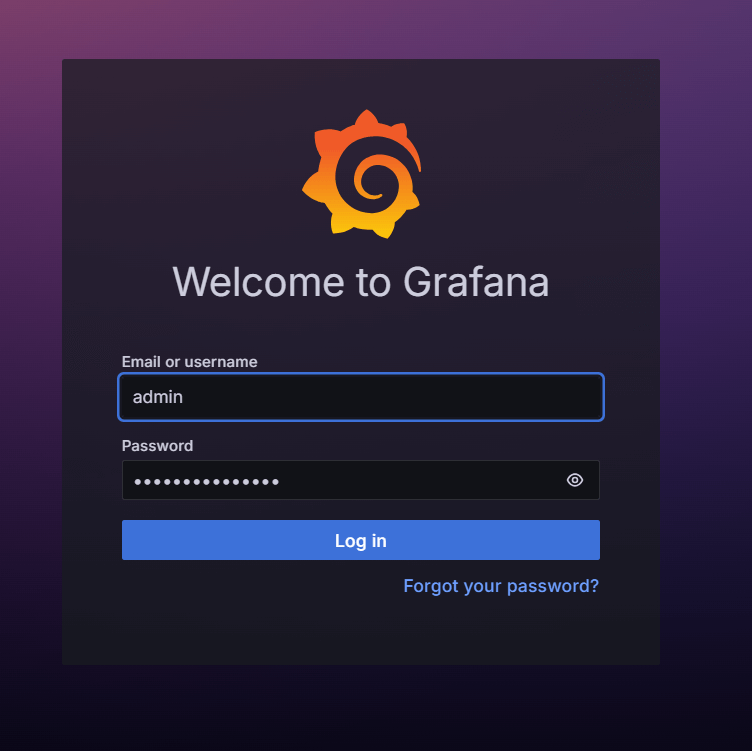
Now, turn your attention to Grafana. Visit the URL http://server-ip:3000 and log in.
The beautiful Grafana welcome page will appear. The main section is replete with useful links for basic information about Grafana. You can also access documentation and basic tutorials, and visit the community pages to stay in the loop on the latest happenings.
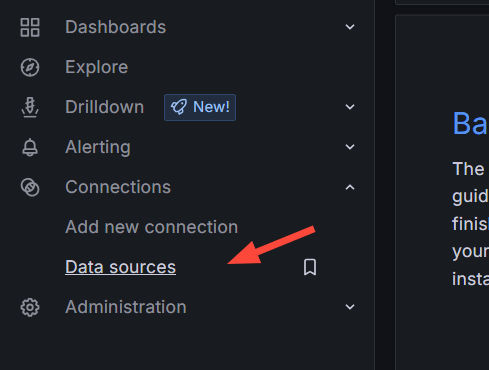
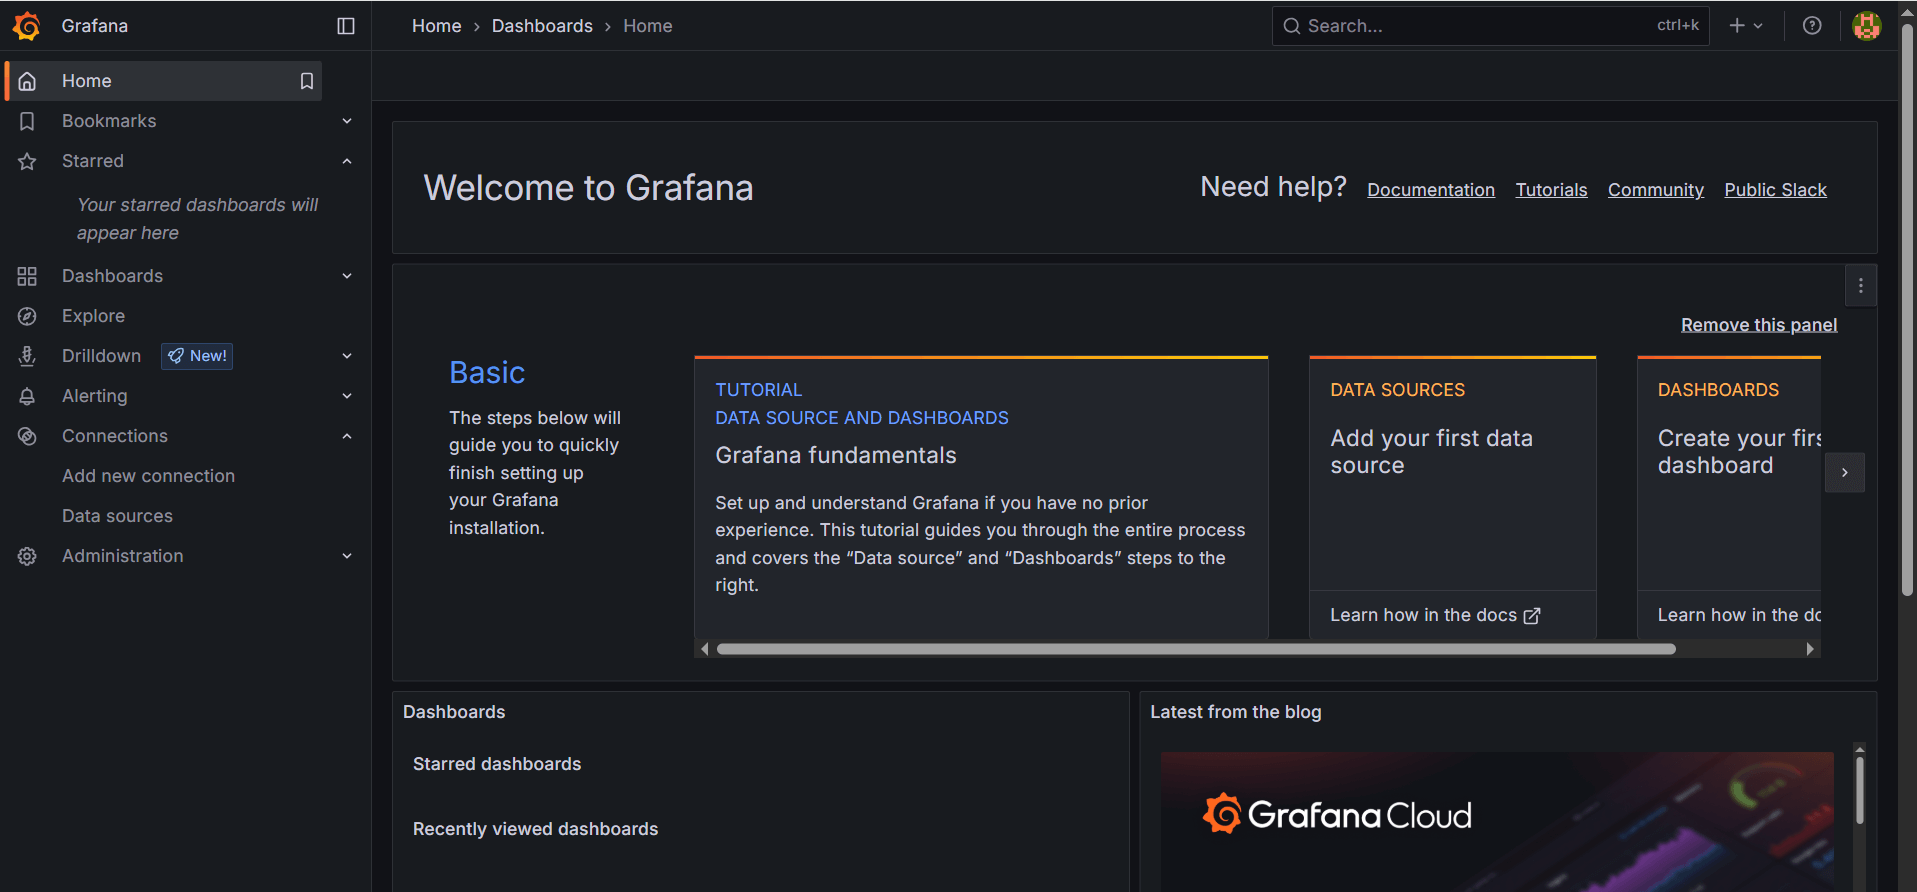 The left sidebar offers numerous options for various Grafana-related tasks. You can create dashboards, add data sources, configure alerts, add new admin users, etc. We aim to connect to Prometheus, so click
 Connections, then select the Data sources option.
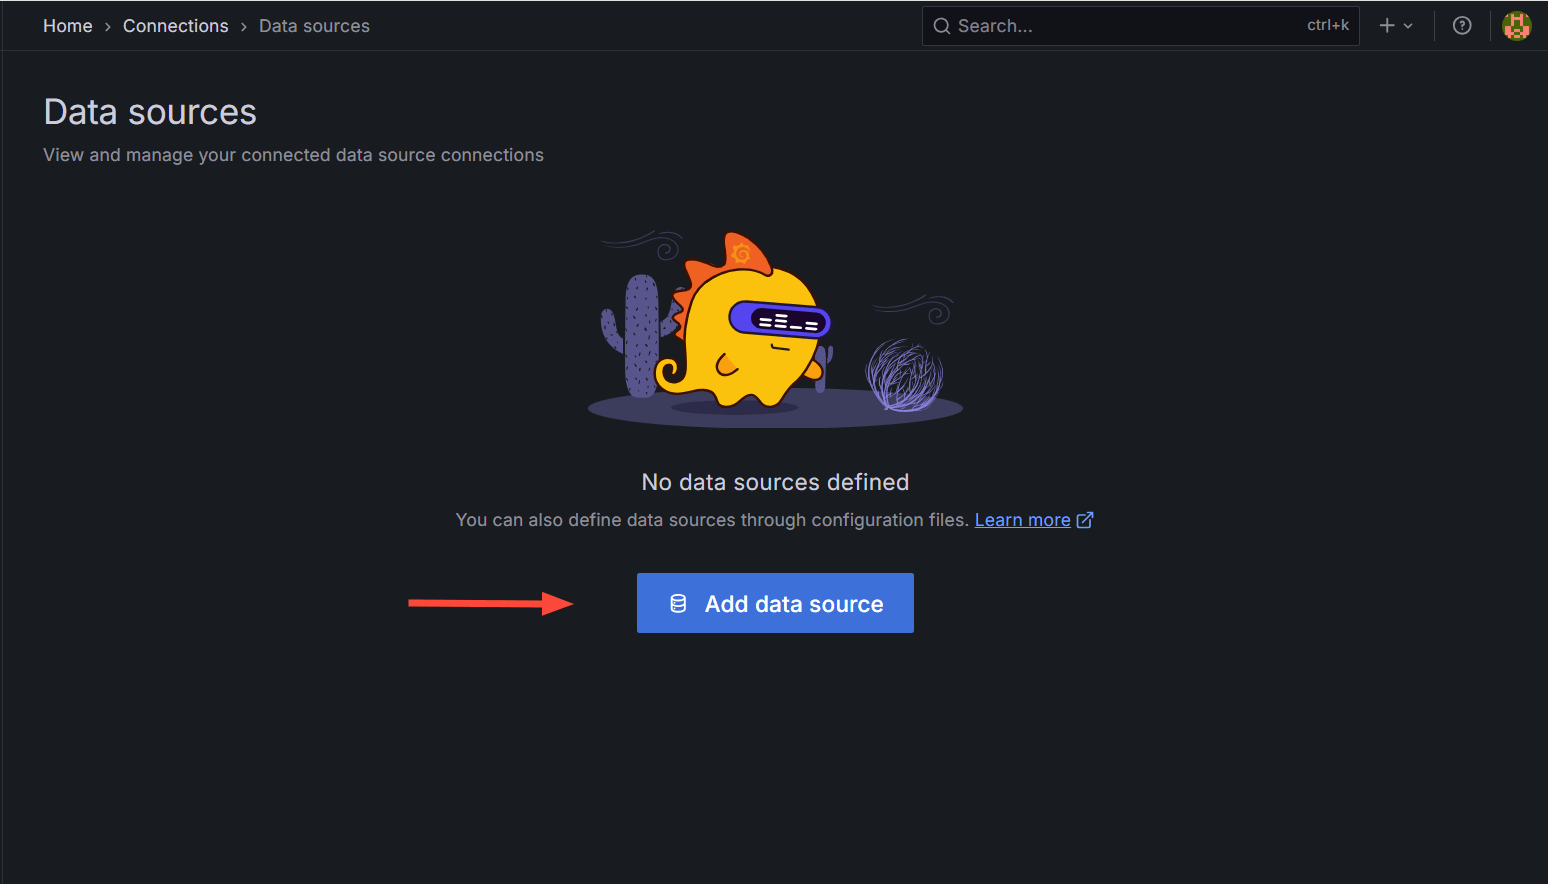
Next, click the Add data source button.
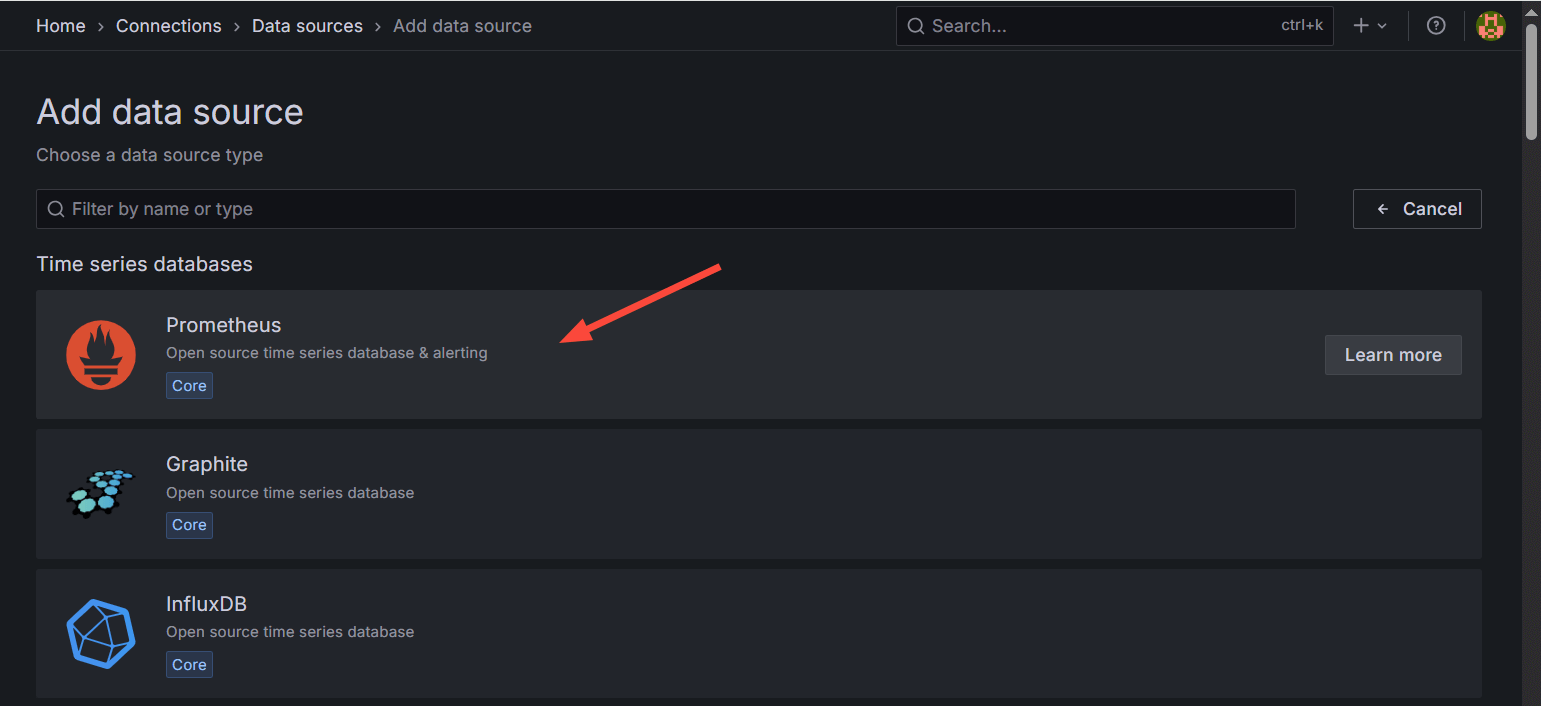
With over 100 data source plugins, Grafana supports many data sources, Prometheus being a favorite. A list of possible data sources will be populated. Since we are connecting to Prometheus, select Prometheus.
In the section that appears, fill out the data source name (give your preferred name) and provide your Prometheus server URL as indicated.
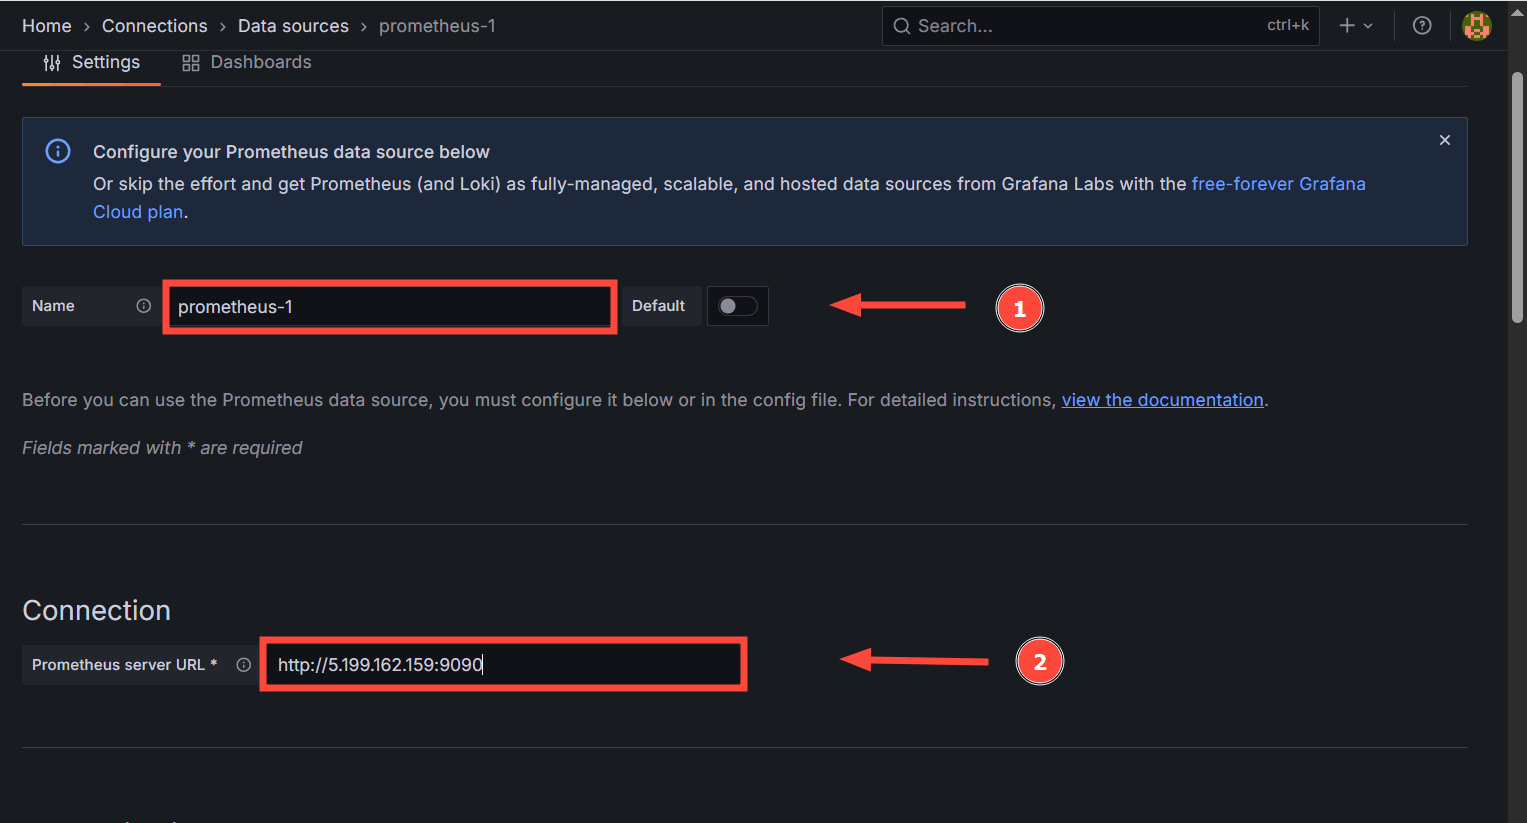
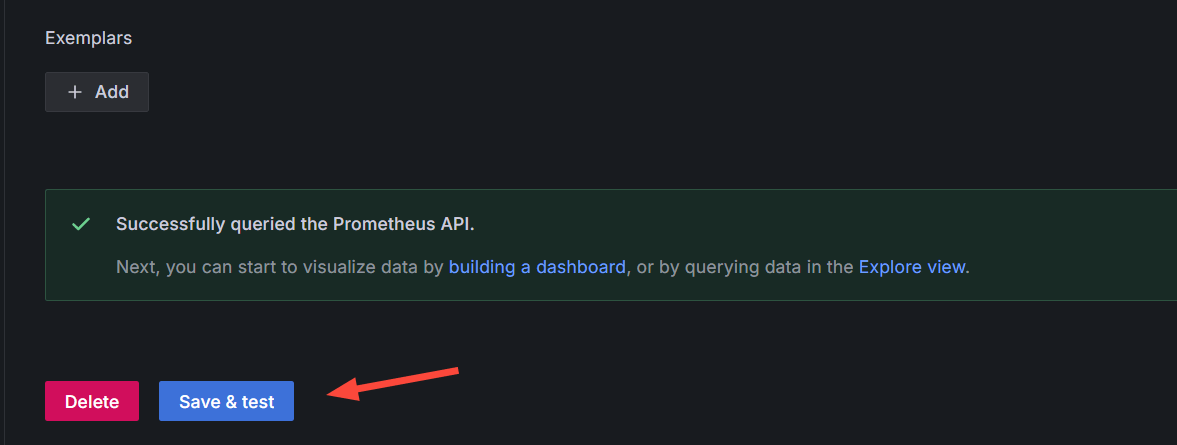
From there, skip the default settings, scroll down, and click the Save and Test button. You should get a pop-up informing you of the successful API query. If you get an error pop-up, ensure you have provided the correct URL and port number.
With the data source successfully added, the next step is to build the dashboards.
#Import a dashboard to visualize metrics
There are two approaches to creating dashboards in Grafana. You can do so manually, but this typically requires mastery and a high skill level, which may not apply to new users or novices. The second, and by far the most preferred option, is leveraging the pre-built dashboards that Grafana offers for visualizing metrics. Check them out at the Grafana dashboards page.
We will import the Node Exporter dashboard to visualize metrics from Prometheus. It provides a neat layout with panels displaying metrics on charts and graphs.
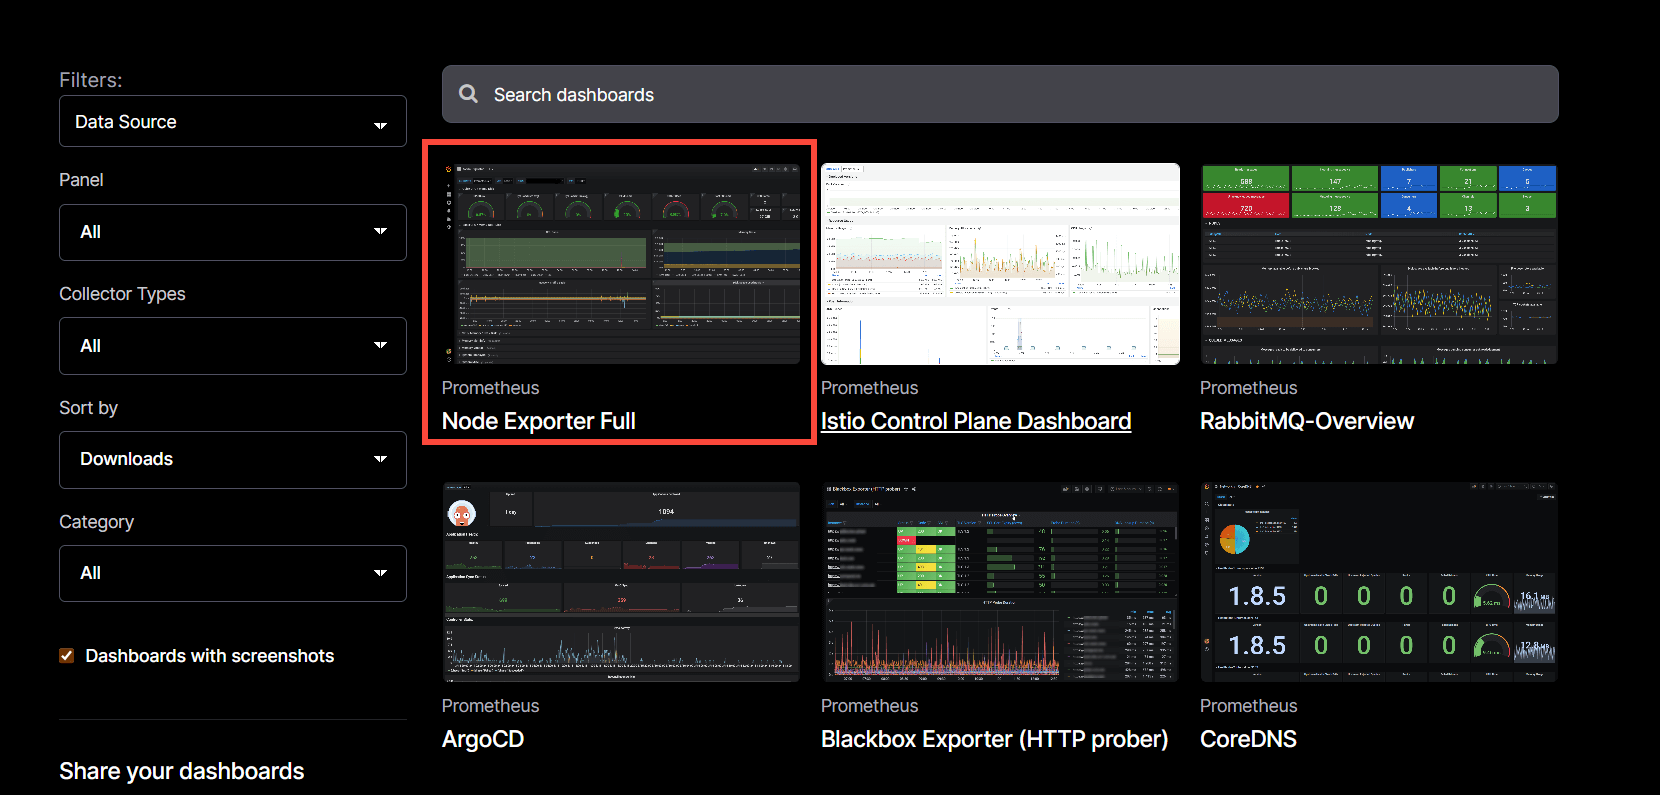
To import the dashboard, head to the Grafana dashboards page and search for the Node Exporter Full dashboard.
On the right section, you will see two options for importing the dashboard. The first option lets you copy the unique ID associated with the dashboard, while the second enables you to download a JSON file. Any of these can work, but we will use the ID to import the dashboard for ease of use. So copy the ID (at the time of writing, 1860 is the Node Exporter Full dashboard ID).
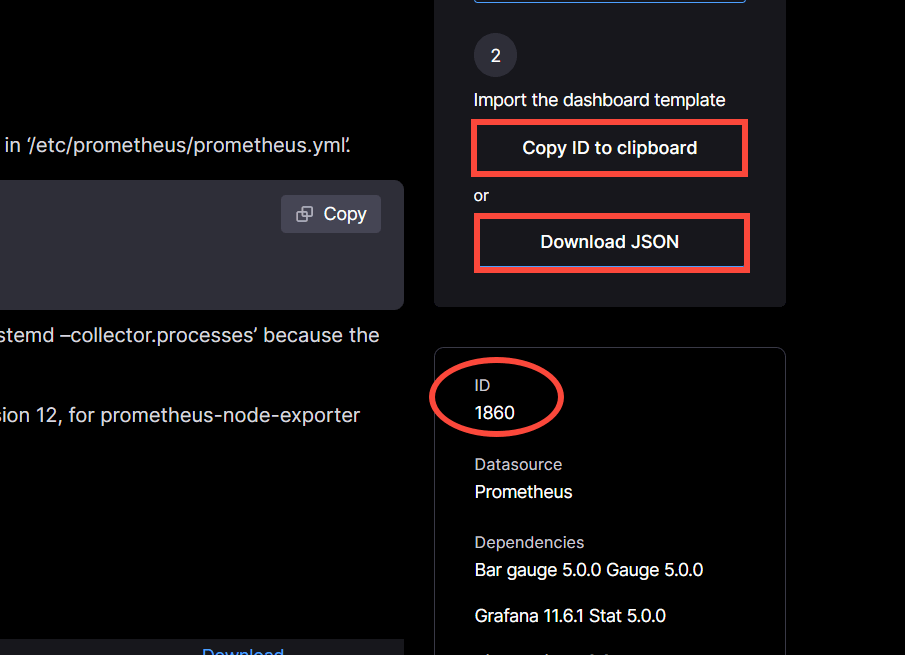
For simplicity, we will use the ID to import the dashboard. So copy the ID (at the time of writing, 1860 is the Node Exporter Full dashboard ID.
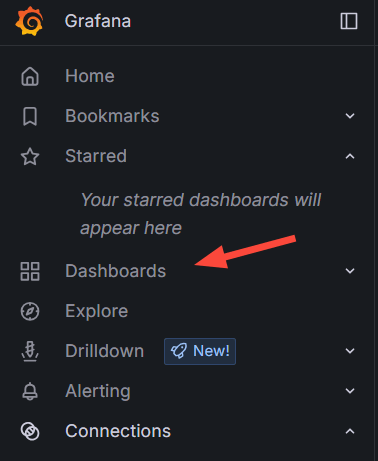
Head back to Grafana and click Dashboards on the left sidebar.
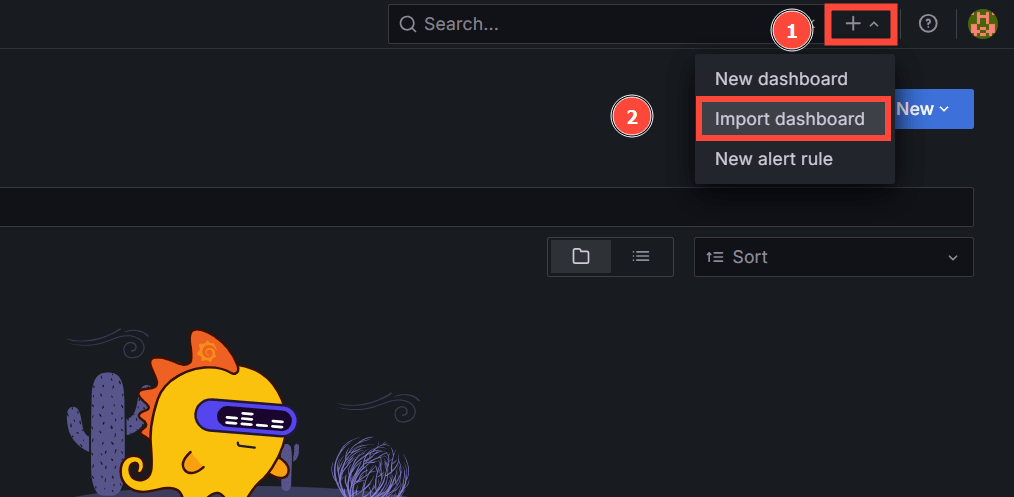
Next, click the plus [+] icon at the top right section and select the Import dashboard option.
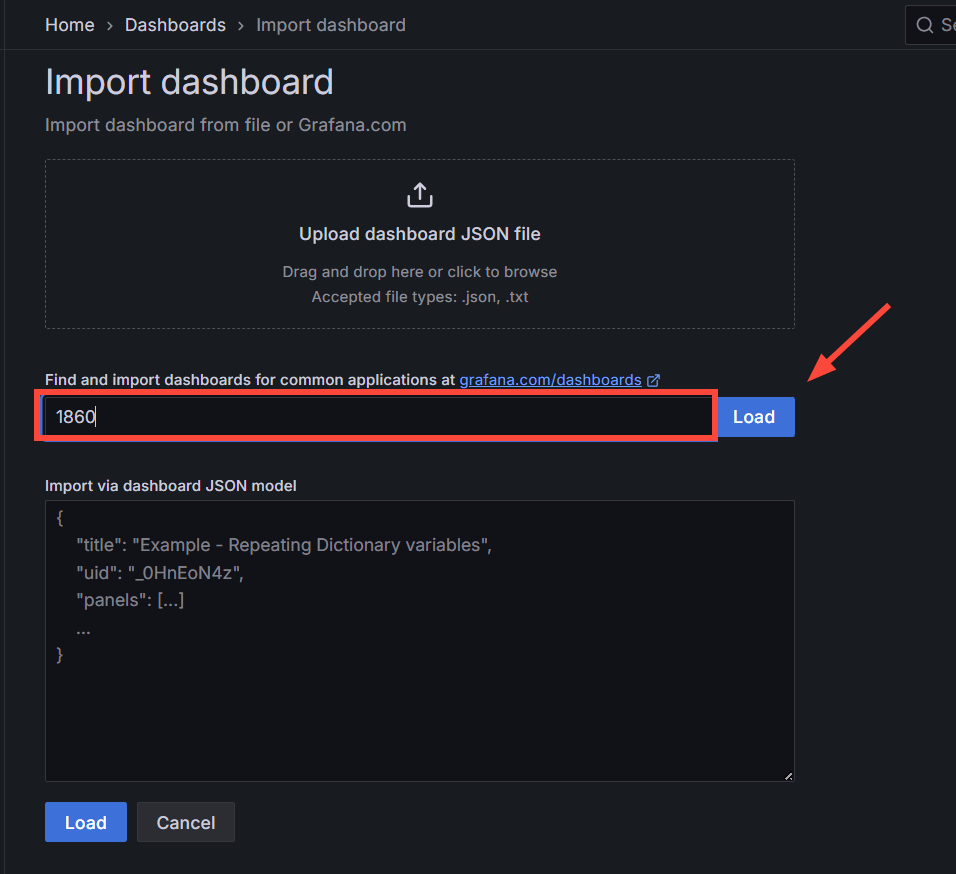
Paste the dashboard ID and click Load.
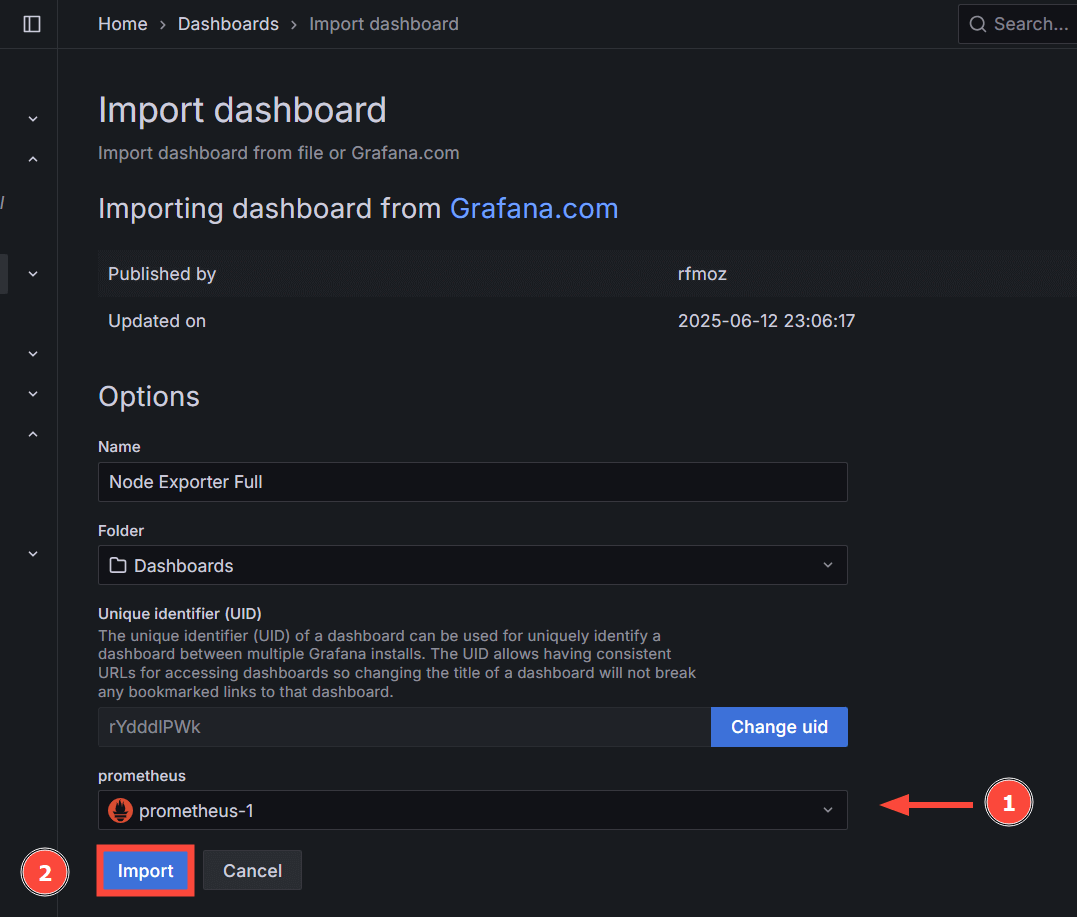
Select your Prometheus data source on the next page and click the Import button.
You should see a neat and elaborate dashboard displaying all the system metrics on various charts and graphs in no time.
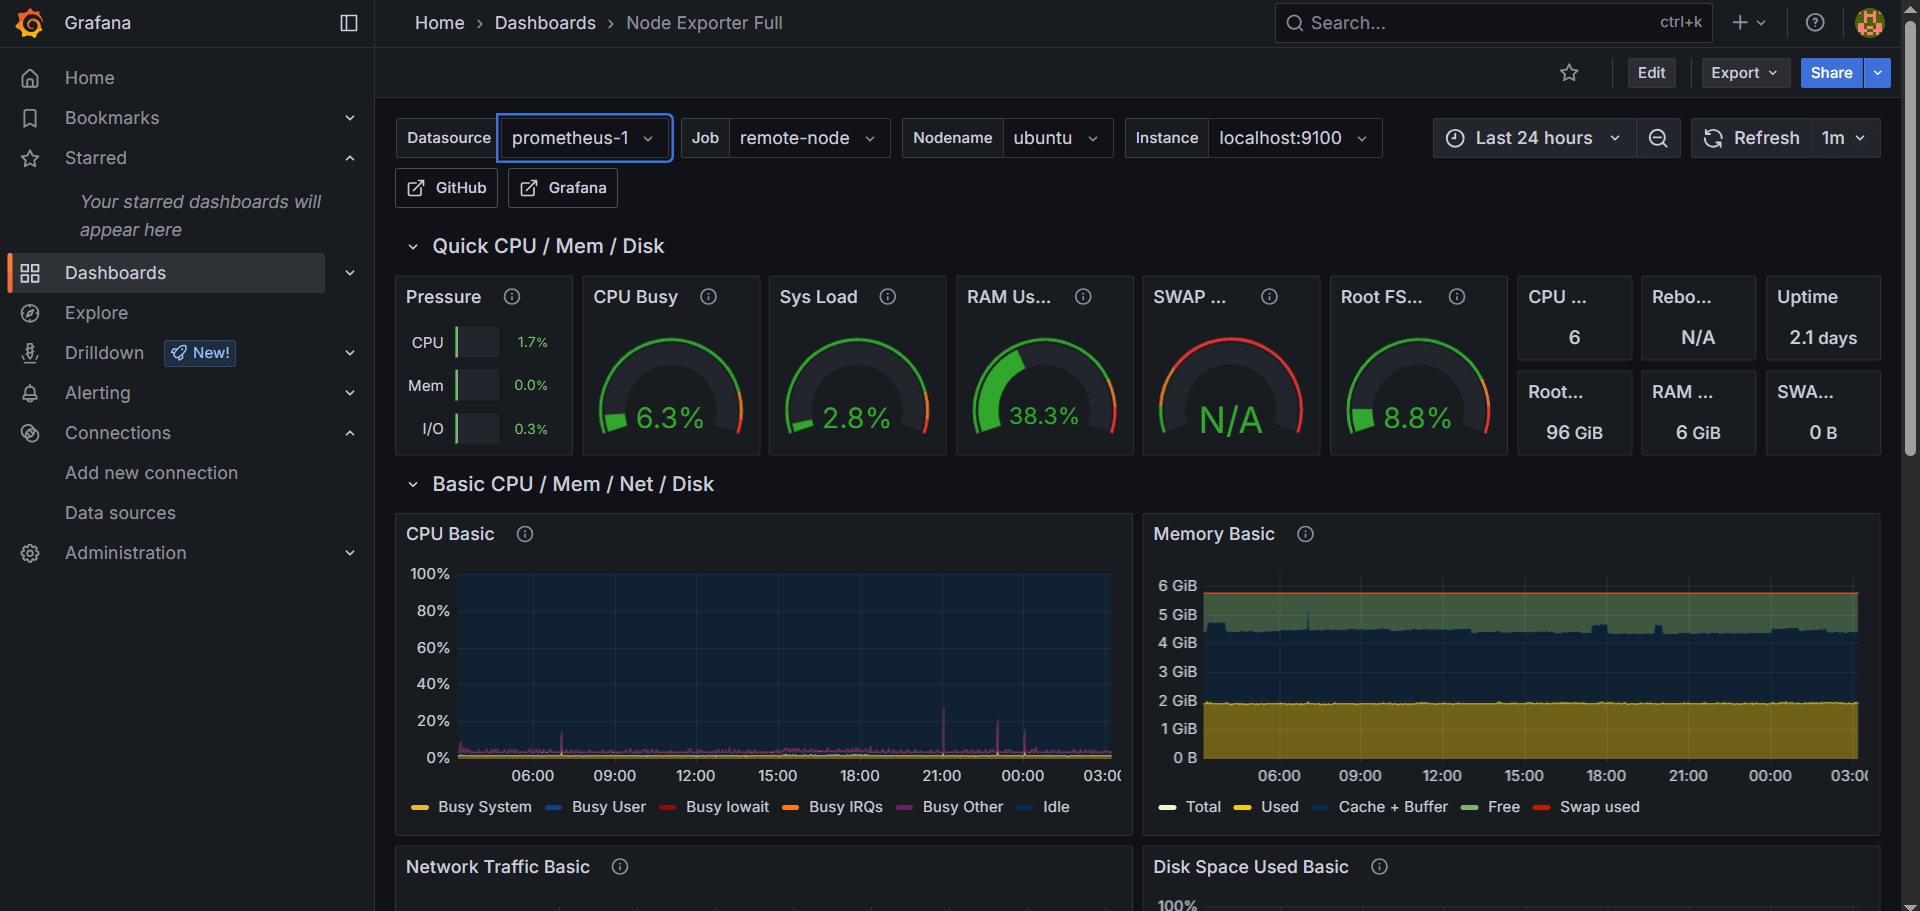
You can scroll down to view more statistics, such as disk throughput, filesystem usage, network traffic, and more.
NOTE
Having Prometheus and Grafana on a single node is only ideal for testing. This is due to scalability limitations and the pressure on computational resources arising from ingesting large amounts of data and visualizing metrics.
In addition, node failure can impact both Grafana and Prometheus, leading to the loss of precious metrics and visualizations. A single point of failure widens the attack surface such that if a node is compromised, all your data is at the mercy of the attacker.
In that regard, we recommend installing the two on separate servers for optimal performance and efficiency, especially in enterprise environments.
And that's it. We have explored how to monitor a server with Prometheus and Grafana.
#Conclusion
Grafana and Prometheus are an excellent, powerful setup for monitoring servers and applications. The two complement each other to offer a robust and reliable monitoring solution. Both tools are open-source and free to install (Grafana has an Enterprise product for enhanced monitoring). Zero licensing fees make Prometheus and Grafana a perfect choice for personal use, small businesses, and even large companies.
In this guide, we explored the integration of Prometheus and Grafana. We added Prometheus as a data source to Grafana and used Grafana's prebuilt dashboards to visualize the server's metrics. We hope you replicate the same steps by selecting one of our fast and scalable virtual servers. You can monitor as many servers as you like by adding multiple Prometheus data sources from different servers.