Top 20 Linux Network Commands (With Examples)


Linux network commands let you inspect interfaces, diagnose connectivity problems, query DNS records, transfer files, and monitor bandwidth directly from the terminal. Every system administrator and developer working with Linux servers needs a working knowledge of these tools to troubleshoot outages, audit open ports, and verify routing.
The 20 commands in this guide cover the core networking tasks you will encounter across most Linux distributions, from basic IP lookups to packet-level diagnostics.
#Prerequisites
To follow along with the examples in this guide, you need:
-
A Linux system (Ubuntu, Debian, RHEL, Fedora, or any major distribution)
-
Root or sudo access for commands that require elevated privileges
-
An active internet connection for testing remote host connectivity and DNS lookups
#Linux network commands quick reference
| Command | Purpose | Example |
|---|---|---|
ip |
Show/manage interfaces, addresses, and routes | ip addr |
ping |
Test host reachability via ICMP | ping -c 4 8.8.8.8 |
hostname |
Display or set the system hostname | hostname -I |
ss |
List open sockets and listening ports | sudo ss -nltu |
netstat |
Show network statistics (deprecated, use ss) | sudo netstat -antpl |
traceroute |
Trace packet path to a remote host | traceroute 8.8.8.8 |
mtr |
Combine ping and traceroute in real time | mtr google.com |
dig |
Query DNS records for a domain | dig cherryservers.com |
nslookup |
Look up DNS name-to-IP mappings | nslookup cherryservers.com |
host |
Simple DNS lookup for a domain | host cherryservers.com |
whois |
Query domain registration details | whois cherryservers.com |
wget |
Download files from the web | wget https://example.com/file.zip |
curl |
Transfer data to or from a server | curl -O https://example.com/file.zip |
ssh |
Connect to a remote host securely | ssh user@192.168.1.10 |
scp |
Copy files over SSH | scp file.txt user@host:/path/ |
nmap |
Scan networks and discover open ports | nmap 192.168.2.0/24 |
arp |
View or modify the ARP cache (deprecated, use ip neigh) | arp |
nmcli |
Manage NetworkManager connections | nmcli connection show |
iftop |
Monitor bandwidth per connection in real time | sudo iftop |
bmon |
Display bandwidth statistics per interface | bmon |
#ip command
The ip command is one of the most basic and helpful network commands in Linux. The command typically displays the status of network interfaces and IP addresses assigned to your system. It succeeds the good old ifconfig command, which is now deprecated.
To display the IP addresses on your system, run the command:
ip a
OR
ip addr
Output1: lo: <LOOPBACK,UP,LOWER_UP> mtu 65536 qdisc noqueue state UNKNOWN group default qlen 1000
link/loopback 00:00:00:00:00:00 brd 00:00:00:00:00:00
inet 127.0.0.1/8 scope host lo
valid_lft forever preferred_lft forever
inet6 ::1/128 scope host noprefixroute
valid_lft forever preferred_lft forever
2: eno1np0: <BROADCAST,MULTICAST,SLAVE,UP,LOWER_UP> mtu 1500 qdisc mq master bond0 state UP group default qlen 1000
link/ether 3c:ec:ef:d0:10:6c brd ff:ff:ff:ff:ff:ff
altname enp81s0f0np0
3: eno2np1: <BROADCAST,MULTICAST,SLAVE,UP,LOWER_UP> mtu 1500 qdisc mq master bond0 state UP group default qlen 1000
link/ether 3c:ec:ef:d0:10:6c brd ff:ff:ff:ff:ff:ff permaddr 3c:ec:ef:d0:10:6d
altname enp81s0f1np1
4: bond0: <BROADCAST,MULTICAST,MASTER,UP,LOWER_UP> mtu 1500 qdisc noqueue state UP group default qlen 1000
link/ether 3c:ec:ef:d0:10:6c brd ff:ff:ff:ff:ff:ff
inet 5.199.172.5/25 brd 5.199.172.127 scope global bond0
valid_lft forever preferred_lft forever
inet6 fe80::3eec:efff:fed0:106c/64 scope link
valid_lft forever preferred_lft forever
5: bond0.2150@bond0: <BROADCAST,MULTICAST,UP,LOWER_UP> mtu 1500 qdisc noqueue state UP group default qlen 1000
link/ether 3c:ec:ef:d0:10:6c brd ff:ff:ff:ff:ff:ff
inet 10.172.77.28/24 brd 10.172.77.255 scope global bond0.2150
valid_lft forever preferred_lft forever
inet6 fe80::3eec:efff:fed0:106c/64 scope link
valid_lft forever preferred_lft forever
In this example, we have the first interface labeled lo, also popularly known as the loopback address or localhost. It always bears the IP of 127.0.0.1 and never deviates from it. It is primarily used for diagnostics.
The second interface (enp0s3) is the system's physical interface with an IP of 192.169.2.105. Your physical network interface might have a different label, such as eth0, and may acquire an IP address from your LAN's subnet.
The ip command also handles routing tables and interface state. To view the current routing table, run:
ip route
The output lists all active routes, including the default gateway. You can add a static route with ip route add <destination> via <gateway>.
To list all network interfaces and their operational state (UP or DOWN), use:
ip link
You can bring an interface up or down with sudo ip link set <interface> up or sudo ip link set <interface> down. The ip command replaces several older utilities, including ifconfig, route, and arp, and serves as the primary tool for network interface management on modern Linux systems.
#ping command
The ping command checks the availability of remote hosts by sending an ICMP echo request awaiting a reply. When a remote target receives the request, it acknowledges it and replies by sending back an echo packet.
The command takes the syntax:
ping ip-address or domain
For example:
ping 5.199.172.5 -c 4
OutputPING 5.199.172.55 (5.199.172.55) 56(84) bytes of data.
64 bytes from 5.199.172.55: icmp_seq=1 ttl=64 time=0.157 ms
64 bytes from 5.199.172.55: icmp_seq=2 ttl=64 time=0.170 ms
64 bytes from 5.199.172.55: icmp_seq=3 ttl=64 time=0.172 ms
64 bytes from 5.199.172.55: icmp_seq=4 ttl=64 time=0.105 ms

--- 5.199.172.55 ping statistics ---
4 packets transmitted, 4 received, 0% packet loss, time 3107ms
rtt min/avg/max/mdev = 0.105/0.151/0.172/0.027 ms
The -c option indicates that we have sent 4 echo packets to the remote node. If the remote host is unavailable, for whatever reason, a Destination Host Unreachable notification will be displayed.
In this example, the ping command tests the availability of a system using its domain name:
ping cherryservers.com -c 4
OutputPING cherryservers.com (5.199.161.87) 56(84) bytes of data.
64 bytes from ip-5-199-161-87.008.ptr.cherryservers.net (5.199.161.87): icmp_seq=1 ttl=62 time=0.283 ms
64 bytes from ip-5-199-161-87.008.ptr.cherryservers.net (5.199.161.87): icmp_seq=2 ttl=62 time=0.313 ms
64 bytes from ip-5-199-161-87.008.ptr.cherryservers.net (5.199.161.87): icmp_seq=3 ttl=62 time=0.286 ms
64 bytes from ip-5-199-161-87.008.ptr.cherryservers.net (5.199.161.87): icmp_seq=4 ttl=62 time=0.263 ms

--- cherryservers.com ping statistics ---
4 packets transmitted, 4 received, 0% packet loss, time 3071ms
rtt min/avg/max/mdev = 0.263/0.286/0.313/0.017 ms
#hostname command
The hostname command displays the hostname of a server. Without any command-line arguments, it shows your server's hostname.
hostname
Outputcherryservers
The -I flag, displays the IP addresses of active network interfaces. In this example, it displays both the private and public IPs associated with the cloud server.
hostname -I
Output5.199.172.5 10.172.77.28
#ss command
An abbreviation for "Socket Statistics", the ss command is a utility that displays UNIX socket connections. The command is an improved version of the old netstat command, which is now deprecated. It offers valuable insights into open ports, listening TCP and UDP sockets, active connections, routing tables, process statistics, and more.
Here's an example of the command usage with a few options.
sudo ss -pnltu
OutputNetid State Recv-Q Send-Q Local Address:Port Peer Address:Port Process
udp UNCONN 0 0 127.0.0.54:53 0.0.0.0:*
udp UNCONN 0 0 127.0.0.53%lo:53 0.0.0.0:*
tcp LISTEN 0 200 0.0.0.0:5432 0.0.0.0:*
tcp LISTEN 0 4096 127.0.0.53%lo:53 0.0.0.0:*
tcp LISTEN 0 4096 127.0.0.54:53 0.0.0.0:*
tcp LISTEN 0 100 0.0.0.0:25 0.0.0.0:*
tcp LISTEN 0 4096 0.0.0.0:22 0.0.0.0:*
tcp LISTEN 0 200 [::]:5432 [::]:*
tcp LISTEN 0 100 [::]:25 [::]:*
tcp LISTEN 0 4096 [::]:22 [::]:*
In this command:
The p flag shows the process name and PID associated with each socket. The n option displays numerical addresses. The l option displays listening sockets. The t flag includes TCP sockets. The u option includes UDP sockets. Check the man pages for more command-line options and usage.
man ss
#netstat command
A portmanteau for 'network statistics', the netstat command is a valuable tool for displaying valuable network-related statistics. Although replaced by the ss command, the command-line utility still serves a useful role in displaying listening sockets ( TCP and UDP ) and open ports and port statistics.
netstat is deprecated on modern Linux distributions. The ss command covered above provides the same functionality with faster performance and more detailed output. If netstat is not available on your system, install it with sudo apt install net-tools (Debian/Ubuntu) or sudo dnf install net-tools (RHEL/Fedora).
The following example displays all listening TCP ports, process name, and their PIDs.
sudo netstat -antpl
In the command syntax:
The a option displays both listening and non-listening sockets. The n displays numerical addresses. The t flag specifies TCP sockets only. The p flag includes the process name and corresponding PIDs. The l flag shows only listening sockets.
OutputActive Internet connections (servers and established)
Proto Recv-Q Send-Q Local Address Foreign Address State PID/Program name
tcp 0 0 0.0.0.0:5432 0.0.0.0:* LISTEN 27900/postgres
tcp 0 0 127.0.0.53:53 0.0.0.0:* LISTEN 22051/systemd-resol
tcp 0 0 127.0.0.54:53 0.0.0.0:* LISTEN 22051/systemd-resol
tcp 0 0 0.0.0.0:25 0.0.0.0:* LISTEN 22511/master
tcp 0 0 0.0.0.0:22 0.0.0.0:* LISTEN 1/systemd
tcp 0 580 5.199.172.5:22 102.88.2.222:42754 ESTABLISHED 4951/sshd: root@pts
tcp6 0 0 :::5432 :::* LISTEN 27900/postgres
tcp6 0 0 :::25 :::* LISTEN 22511/master
tcp6 0 0 :::22 :::* LISTEN 1/systemd
#traceroute command
The traceroute command keenly traces the path taken by data packets as they travel from one router to another, a sequence known as hops. Loss of packets in a hop indicates that remediation measures should be taken to address packet loss and connection issues.
The traceroute tool is not installed by default on Ubuntu. Install it with:
sudo apt install traceroute -y
The traceroute command takes the following syntax.
traceroute ip-address
The following example probes the flow of data packets to Google's DNS ( 8.8.8.8).
traceroute 8.8.8.8
Outputtraceroute to 8.8.8.8 (8.8.8.8), 30 hops max, 60 byte packets
1 ip-5-199-172-1.008.ptr.cherryservers.net (5.199.172.1) 0.332 ms 0.428 ms 0.546 ms
2 ip-46-166-166-16.005.ptr.cherryservers.net (46.166.166.16) 0.154 ms ip-46-166-166-30.009.ptr.cherryservers.net (46.166.166.30) 0.638 ms ip-46-166-166-16.005.ptr.cherryservers.net (46.166.166.16) 0.272 ms
3 213-190-41-193.static.telecom.lt (213.190.41.193) 4.385 ms 88-118-128-66.static.zebra.lt (88.118.128.66) 7.045 ms 213-190-41-193.static.telecom.lt (213.190.41.193) 4.388 ms
4 10.41.100.2 (10.41.100.2) 7.896 ms 7.717 ms dns.google (8.8.8.8) 12.194 ms
#mtr command
Short for My Traceroute, the mtr command combines the functionality of traceroute and ping. It checks for the accessibility of a host target while also probing the path taken by data packets to the destination.
mtr google.com
Outputcherryservers (5.199.172.5) -> google.com (142.250.109.139) 2026-04-18T16:45:04+0000
Keys: Help Display mode Restart statistics Order of fields quit
Packets Pings
Host Loss% Snt Last Avg Best Wrst StDev
1. ip-5-199-172-1.008.ptr.cherryservers.net 0.0% 22 21.2 2.3 0.4 21.2 5.7
2. ip-46-166-166-16.005.ptr.cherryservers.net 0.0% 22 0.3 0.3 0.2 0.4 0.1
3. 84.15.3.121 0.0% 22 4.4 4.4 4.3 4.5 0.0
4. (waiting for reply)
5. 84.15.69.42 90.0% 21 26.0 26.0 26.0 26.0 0.0
6. 142.251.195.144 0.0% 21 26.0 26.0 25.9 26.8 0.2
7. 108.170.236.173 0.0% 21 27.5 27.6 26.3 28.5 0.7
8. 142.250.238.130 0.0% 21 26.6 26.8 26.5 28.2 0.4
9. 209.85.252.29 0.0% 21 26.6 26.5 26.5 26.6 0.0
10. 108.170.233.108 0.0% 21 40.0 40.0 39.7 41.9 0.5
11. 72.14.233.3 0.0% 21 33.0 33.4 32.7 45.4 2.7
12. 192.178.97.59 0.0% 21 33.5 33.6 33.4 33.9 0.1
13. 216.239.62.224 0.0% 21 33.1 33.2 33.1 33.4 0.1
14. (waiting for reply)
15. (waiting for reply)
16. (waiting for reply)
17. (waiting for reply)
18. (waiting for reply)
19. (waiting for reply)
20. zr-in-f139.1e100.net 0.0% 21 32.7 32.7 32.7 32.7 0.0
To exit from the output, press ‘q’ on the keyboard.
#dig command
The dig command is a shorthand for Domain Information Groper. It's a DNS lookup network utility primarily used for verifying and diagnosing DNS issues. The dig command replaces the older nslookup and host commands.
The command can return the following DNS records:
A record: Maps a hostname directly to an IP address.
MX record: Mail Exchange record. Specifies the email server for the domain.
SIG: Signature record for encryption protocols.
For instance, to perform a DNS lookup for cherrryservers.com, run the command:
dig cherryservers.com
Pay close attention to the ANSWER SECTION.
The first column indicates the domain name of the server. The second column is the TTL (Time to Live), in this case, 30. The third column indicates the query class. Here, the directive IN is short for the internet. The fourth column shows the query type, in this case, the A record. The last column shows the IP address that maps to the domain name.
Output; <<>> DiG 9.18.39-0ubuntu0.24.04.3-Ubuntu <<>> cherryservers.com
;; global options: +cmd
;; Got answer:
;; ->>HEADER<<- opcode: QUERY, status: NOERROR, id: 57226
;; flags: qr rd ra; QUERY: 1, ANSWER: 1, AUTHORITY: 0, ADDITIONAL: 1

;; OPT PSEUDOSECTION:
; EDNS: version: 0, flags:; udp: 65494
;; QUESTION SECTION:
;cherryservers.com.  IN  A

;; ANSWER SECTION:
cherryservers.com.  30  IN  A  84.32.188.121

;; Query time: 29 msec
;; SERVER: 127.0.0.53#53(127.0.0.53) (UDP)
;; WHEN: Sat Apr 18 16:45:53 UTC 2026
;; MSG SIZE rcvd: 62
To display the ANSWER section only, run the command:
dig cherryservers.com +noall +answer
Outputcherryservers.com. 30 IN A 5.199.161.87
To query the IP address that maps to the domain name and omit other details, use the +short flag.
dig cherryservers.com +short
Output5.199.161.87
Notably, the dig command is quite verbose and includes a lot of comments. To reduce the verbosity, include the +nocomments option.
dig cherryservers.com +nocomments
Output; <<>> DiG 9.18.39-0ubuntu0.24.04.3-Ubuntu <<>> cherryservers.com +nocomments
;; global options: +cmd
;cherryservers.com.  IN  A
cherryservers.com.  30  IN  A  5.199.161.87
;; Query time: 30 msec
;; SERVER: 127.0.0.53#53(127.0.0.53) (UDP)
;; WHEN: Sat Apr 18 16:55:01 UTC 2026
;; MSG SIZE rcvd: 62
To query the MX record, use the MX flag.
dig cherryservers.com MX
Output; <<>> DiG 9.18.39-0ubuntu0.24.04.3-Ubuntu <<>> cherryservers.com MX
;; global options: +cmd
;; Got answer:
;; ->>HEADER<<- opcode: QUERY, status: NOERROR, id: 50142
;; flags: qr rd ra; QUERY: 1, ANSWER: 1, AUTHORITY: 0, ADDITIONAL: 1

;; OPT PSEUDOSECTION:
; EDNS: version: 0, flags:; udp: 65494
;; QUESTION SECTION:
;cherryservers.com.  IN  MX

;; ANSWER SECTION:
cherryservers.com.  3600  IN  MX  0 cherryservers-com.mail.protection.outlook.com.

;; Query time: 42 msec
;; SERVER: 127.0.0.53#53(127.0.0.53) (UDP)
;; WHEN: Sat Apr 18 16:55:39 UTC 2026
;; MSG SIZE rcvd: 104
#nslookup command
A shorthand for 'Name Server Lookup, the nslookup is another useful tool for performing DNS lookups. The command probes a DNS server for information such as the IP address, domain name mapping, and other DNS records. Despite being replaced by the dig command, the nslookup utility is a handy network diagnostic tool for troubleshooting DNS-related issues.
The following command performs a DNS lookup for the domain cherryservers.com.
nslookup cherryservers.com
OutputServer:  127.0.0.53
Address:  127.0.0.53#53

Non-authoritative answer:
Name:  cherryservers.com
Address: 5.199.161.87
You can specify the type of record using the type= option and specify the record type. For example, to view the MX record for the domain, run the command:
nslookup -type=mx cherryservers.com
OutputServer:  127.0.0.53
Address:  127.0.0.53#53

Non-authoritative answer:
cherryservers.com  mail exchanger = 0 cherryservers-com.mail.protection.outlook.com.

Authoritative answers can be found from:
To check the Name Server (ns) records - which maps a domain to a group of nameservers - use the ns argument.
nslookup -type=ns google.com
OutputServer:  127.0.0.53
Address:  127.0.0.53#53

Non-authoritative answer:
google.com  nameserver = ns2.google.com.
google.com  nameserver = ns4.google.com.
google.com  nameserver = ns1.google.com.
google.com  nameserver = ns3.google.com.

Authoritative answers can be found from:
For mail server information, pass the mx argument.
nslookup -type=mx google.com
OutputServer:  127.0.0.53
Address:  127.0.0.53#53

Non-authoritative answer:
google.com  mail exchanger = 10 smtp.google.com.

Authoritative answers can be found from:
Also read: Linux shutdown command guide
#host command
The host command is a user-friendly DNS lookup tool that displays a domain's IP and mail server (if one exists). To display a registered domain's information, simply provide the domain name as the argument as shown.
host domain
Outputgoogle.com has address 142.250.109.138
google.com has address 142.250.109.100
google.com has address 142.250.109.113
google.com has address 142.250.109.139
google.com has address 142.250.109.102
google.com has address 142.250.109.101
google.com has IPv6 address 2a00:1450:4025:800::65
google.com has IPv6 address 2a00:1450:4025:800::8b
google.com has IPv6 address 2a00:1450:4025:800::8a
google.com has IPv6 address 2a00:1450:4025:800::66
google.com mail is handled by 10 smtp.google.com.
#whois command
The whois command is a protocol for performing domain lookups by querying a distributed database system. The protocol returns information about the domain, such as domain ownership, registration date, business contact information, etc.
The whois tool is not pre-installed on Ubuntu. Install it with:
sudo apt install whois -y
To run the command, provide the domain name after the whois directive.
whois domain
OutputDomain Name: CHERRYSERVERS.COM
Registry Domain ID: 176836252_DOMAIN_COM-VRSN
Registrar WHOIS Server: whois.domains.domreg.lt
Registrar URL: https://domains.lt
Updated Date: 2025-05-30T08:11:04Z
Creation Date: 2005-06-30T04:02:12Z
Registry Expiry Date: 2026-06-30T04:02:12Z
Registrar: Kaunas University of Technology
Registrar IANA ID: 1318
Registrar Abuse Contact Email: abuse@domreg.lt
Registrar Abuse Contact Phone: +370.37300606
Domain Status: ok https://icann.org/epp#ok
Name Server: NS1-07.AZURE-DNS.COM
Name Server: NS2-07.AZURE-DNS.NET
Name Server: NS3-07.AZURE-DNS.ORG
Name Server: NS4-07.AZURE-DNS.INFO
DNSSEC: unsigned
URL of the ICANN Whois Inaccuracy Complaint Form: https://www.icann.org/wicf/
>>> Last update of whois database: 2026-04-18T17:06:24Z <<<
#wget command
The wget command downloads files from the internet using the resource's URL. The tool takes the following syntax:
wget [options] [URL]
The example shown downloads Wordpress' installation zip file called latest.zip.
wget https://wordpress.org/latest.zip
Output--2026-04-18 17:08:10-- https://wordpress.org/latest.zip
Resolving wordpress.org (wordpress.org)... 198.143.164.252, 2607:f978:5:8002::c68f:a4fc
Connecting to wordpress.org (wordpress.org)|198.143.164.252|:443... connected.
HTTP request sent, awaiting response... 200 OK
Length: 28686458 (27M) [application/zip]
Saving to: 'latest.zip'

latest.zip 100%[===============================================================>] 27.36M 15.0MB/s in 1.8s

2026-04-18 17:08:13 (15.0 MB/s) - 'latest.zip' saved [28686458/28686458]
The uppercase -O option saves the file to be downloaded under a different name. Here, we save the file as wordpress.zip.
wget -O wordpress.zip https://wordpress.org/latest.zip
Output--2026-04-18 17:09:43-- https://wordpress.org/latest.zip
Resolving wordpress.org (wordpress.org)... 198.143.164.252, 2607:f978:5:8002::c68f:a4fc
Connecting to wordpress.org (wordpress.org)|198.143.164.252|:443... connected.
HTTP request sent, awaiting response... 200 OK
Length: 28686458 (27M) [application/zip]
Saving to: 'wordpress.zip'

wordpress.zip 100%[===============================================================>] 27.36M 15.2MB/s in 1.8s

2026-04-18 17:09:46 (15.2 MB/s) - 'wordpress.zip' saved [28686458/28686458]
The - P option specifies a different directory for saving the file. Here, we save the file in the /tmp folder.
wget -P /tmp https://wordpress.org/latest.zip
Output--2026-04-18 17:12:07-- https://wordpress.org/latest.zip
Resolving wordpress.org (wordpress.org)... 198.143.164.252, 2607:f978:5:8002::c68f:a4fc
Connecting to wordpress.org (wordpress.org)|198.143.164.252|:443... connected.
HTTP request sent, awaiting response... 200 OK
Length: 28686458 (27M) [application/zip]
Saving to: '/tmp/latest.zip'

latest.zip 100%[===============================================================>] 27.36M 15.0MB/s in 1.8s

2026-04-18 17:12:09 (15.0 MB/s) - '/tmp/latest.zip' saved [28686458/28686458]
You can download multiple files sequentially by saving file URLs in a text file and passing the -i option to the wget command. In this example, the sample_file.txt file contains the following links.
https://www.python.org/ftp/python/3.13.0/Python-3.13.0.tgz
https://wordpress.org/latest.zip
To download the files, pass the -i option as shown.
wget -i sample_file.txt
Output--2026-04-18 17:27:29-- https://www.python.org/ftp/python/3.13.0/Python-3.13.0.tgz
Resolving www.python.org (www.python.org)... 151.101.64.223, 151.101.0.223, 151.101.128.223, ...
Connecting to www.python.org (www.python.org)|151.101.64.223|:443... connected.
HTTP request sent, awaiting response... 200 OK
Length: 29186321 (28M) [application/octet-stream]
Saving to: 'Python-3.13.0.tgz'

Python-3.13.0.tgz 100%[===============================================================>] 27.83M 79.8MB/s in 0.3s

2026-04-18 17:27:29 (79.8 MB/s) - 'Python-3.13.0.tgz' saved [29186321/29186321]

--2026-04-18 17:27:29-- https://wordpress.org/latest.zip
Resolving wordpress.org (wordpress.org)... 198.143.164.252, 2607:f978:5:8002::c68f:a4fc
Connecting to wordpress.org (wordpress.org)|198.143.164.252|:443... connected.
HTTP request sent, awaiting response... 200 OK
Length: 28686458 (27M) [application/zip]
Saving to: 'latest.zip.1'

latest.zip.1 100%[===============================================================>] 27.36M 15.0MB/s in 1.8s

2026-04-18 17:27:31 (15.0 MB/s) - 'latest.zip.1' saved [28686458/28686458]

FINISHED --2026-04-18 17:27:31--
Total wall clock time: 2.8s
Downloaded: 2 files, 55M in 2.2s (25.4 MB/s)
#cURL command
cuRL (client URL) is a networking CLI tool that transfers data to and from a server or host system by specifying the server's URL. It supports a range of protocols, including HTTP, HTTPS, and FTP.
The command uses the following syntax:
curl [options] [URL]
Without any command-line options, the curl command fetches the contents of a webpage. The following command prints the contents of the example.com HTML page to stdout.
curl example.com
Output<!doctype html>
<html lang="en">
<head>
    <title>Example Domain</title>
    <meta name="viewport" content="width=device-width, initial-scale=1">
    <style>
        body {
            background: #eee;
            width: 60vw;
            margin: 15vh auto;
            font-family: system-ui, sans-serif;
        }
        h1 {
            font-size: 1.5em;
        }
        div {
            opacity: 0.8;
        }
        a:link,
        a:visited {
            color: #348;
        }
    </style>
</head>
<body>
    <div>
        <h1>Example Domain</h1>
        <p>This domain is for use in documentation examples without needing permission. Avoid use in operations.</p>
        <p><a href="https://iana.org/domains/example">Learn more</a></p>
    </div>
</body>
</html>
To download a resource, for example, the WordPress compressed file, run the following command. The -O option includes a download progress meter that measures download speed, data transfer rate, total time spent, and remaining download time.
curl -O https://wordpress.org/latest.zip
Output% Total % Received % Xferd Average Speed Time Time Time Current
Dload Upload Total Spent Left Speed
100 27.3M 100 27.3M 0 0 12.3M 0 0:00:02 0:00:02 --:--:-- 12.3M
To save the file under a different name pass the lowercase o switch. This example saves the file as wordpress.zip.
curl -o wordpress.zip https://wordpress.org/latest.zip
The I option lets you retrieve the HTTP headers of a file.
curl -I [example.com](http://example.com)
OutputHTTP/1.1 200 OK
Date: Sat, 18 Apr 2026 17:59:22 GMT
Content-Type: text/html
Connection: keep-alive
Server: cloudflare
Last-Modified: Sat, 18 Apr 2026 00:51:00 GMT
Allow: GET, HEAD
Accept-Ranges: bytes
Age: 1597
cf-cache-status: HIT
CF-RAY: 9ee5901d9f01ce1a-VNO
#ssh command
The ssh command is used to connect to a remote host securely over a TCP/IP network. The command uses the following syntax:
ssh username@ip-address
Where: username is the user on the remote host.
ip-address represents the IP of the remote host. Additionally, a registered domain name can be provided instead.
For example:
ssh root@5.199.168.47
By default, SSH listens on port 22. If not the case, the -p flag lets you specify the port number during connection. In this example, SSH on the remote host listens on port 5422. To connect to the host, we will run the command:
ssh -p 5422 root@5.199.168.47
#scp command
The scp ( Secure Copy ) is a command-line tool that leverages SSH's strong encryption algorithms to copy files securely over a network.
Here's the syntax:
scp filename username@hostname_or_IP:/remote/path/
The following command copies a file sample_file.txt to a remote server in the /home/cherry path, which is the remote user's home directory.
scp sample_file.txt root@5.199.168.47:/home/cherry
To copy a directory, use the -r for recursive copying. This copies the directory and its entire contents to the remote server. Here, we are copying a directory named data to the remote server.
scp -r data root@5.199.168.47:/home/cherry
Conversely, you can copy files/directories from the remote server to the local system.
scp username@hostname_or_IP:/remote/file/ /local/path
The command shown copies file1.txt from the remote host to the local machine's home directory specified by the $HOME environment variable.
scp root@5.199.168.47:/home/cherry/file1.txt $HOME
#Nmap command
Network Mapper, or Nmap for short, is a flexible and open-source utility mainly used for network scanning and reconnaissance. It is used to perform vulnerability assessments on host systems.
Nmap is not included in Ubuntu's default installation. Install it with:
sudo apt install nmap -y
In this example, nmap scans for all the hosts in the 5.199.172.5/24 subnet.
nmap 5.199.172.5/24
OutputStarting Nmap 7.94SVN ( https://nmap.org ) at 2026-04-18 18:04 UTC
Nmap scan report for ip-5-199-172-1.008.ptr.cherryservers.net (5.199.172.1)
Host is up (0.015s latency).
Not shown: 999 closed tcp ports (reset)
PORT STATE SERVICE
179/tcp open bgp
MAC Address: 14:18:77:0F:4E:AA (Dell)

Nmap scan report for ip-5-199-172-2.009.ptr.cherryservers.net (5.199.172.2)
Host is up (0.00038s latency).
Not shown: 999 closed tcp ports (reset)
PORT STATE SERVICE
179/tcp open bgp
MAC Address: F4:8E:38:61:0B:10 (Dell)

Nmap scan report for ip-5-199-172-3.010.ptr.cherryservers.net (5.199.172.3)
Host is up (0.00018s latency).
Not shown: 914 filtered tcp ports (no-response), 85 filtered tcp ports (admin-prohibited)
PORT STATE SERVICE
9091/tcp open xmltec-xmlmail
MAC Address: 3C:EC:EF:D0:48:C2 (Super Micro Computer)

...
To reveal more detailed or intricate information such as service versions pass the -A switch.
nmap -A 5.199.172.5/24
OutputStarting Nmap 7.94SVN ( https://nmap.org ) at 2026-04-18 18:08 UTC
Nmap scan report for ip-5-199-172-1.008.ptr.cherryservers.net (5.199.172.1)
Host is up (0.010s latency).
Not shown: 999 closed tcp ports (reset)
PORT STATE SERVICE VERSION
179/tcp open bgp (connection rejected)
MAC Address: 14:18:77:0F:4E:AA (Dell)
Aggressive OS guesses: NEC WarpStar router (89%), NTT RV-230NE router (89%), IBM z/VM 4.2 (88%), Cisco Catalyst 6509-E switch (IOS 12.2) (88%), NetBSD 3.1 - 4.0 (AMD64) (87%), NetBSD 3.1.1 (87%), IBM z/OS 1.12 (87%), OpenBSD 4.4 (87%), Sony PlayStation 3 game console (86%), NetBSD 4.0_BETA2, Feb. 21st CVS snapshot (86%)
No exact OS matches for host (test conditions non-ideal).
Network Distance: 1 hop

TRACEROUTE
HOP RTT ADDRESS
1 10.41 ms ip-5-199-172-1.008.ptr.cherryservers.net (5.199.172.1)

...
To scan a single host provide its IP address.
nmap -A 5.199.172.5
OutputStarting Nmap 7.94SVN ( https://nmap.org ) at 2026-04-18 19:12 UTC
Nmap scan report for ip-5-199-172-5.002.ptr.cherryservers.net (5.199.172.5)
Host is up (0.000039s latency).
Not shown: 997 closed tcp ports (reset)
PORT STATE SERVICE VERSION
22/tcp open ssh OpenSSH 9.6p1 Ubuntu 3ubuntu13.15 (Ubuntu Linux; protocol 2.0)
| ssh-hostkey:
| 256 8d:75:52:99:19:fe:87:22:c9:0b:a3:9a:85:8d:81:c5 (ECDSA)
|_ 256 14:59:6a:c2:97:be:8f:ac:e0:61:db:64:0d:59:1c:69 (ED25519)
25/tcp open smtp Postfix smtpd
|_smtp-commands: cb866b57ccb0, PIPELINING, SIZE 10240000, VRFY, ETRN, STARTTLS, ENHANCEDSTATUSCODES, 8BITMIME, DSN, SMTPUTF8, CHUNKING
| ssl-cert: Subject: commonName=cb866b57ccb0
| Subject Alternative Name: DNS:cb866b57ccb0
| Not valid before: 2026-01-13T08:13:56
|_Not valid after: 2036-01-11T08:13:56
|_ssl-date: TLS randomness does not represent time
5432/tcp open postgresql PostgreSQL DB 9.6.0 or later
| ssl-cert: Subject: commonName=cb866b57ccb0
| Subject Alternative Name: DNS:cb866b57ccb0

...
#arp command
The arp command manages the ARP cache on your system. It is used to display or modify ARP cache information. The ARP cache is simply a table that provides a mapping of IP addresses to their MAC addresses in the network. In addition to displaying the entries, you can modify and delete them from the cache.
The arp command is part of the net-tools package, which is deprecated on modern distributions. The recommended replacement is ip neigh, which displays and manages the neighbor (ARP) table using the ip command. For example, run ip neigh show to list all ARP entries.
Since arp is part of the deprecated net-tools package, you may need to install it first:
sudo apt install net-tools -y
To display the entries, run:
arp
OutputAddress HWtype HWaddress Flags Mask Iface
ip-5-199-172-7.004.ptr. ether 3c:ec:ef:d0:12:2a C bond0
ip-5-199-172-62.009.ptr ether 7c:c2:55:31:64:54 C bond0
ip-5-199-172-52.009.ptr ether 3c:ec:ef:b1:67:90 C bond0
ip-5-199-172-69.006.ptr ether 7c:c2:55:31:68:50 C bond0
ip-5-199-172-27.004.ptr ether 3c:ec:ef:d0:4f:8e C bond0
ip-5-199-172-41.008.ptr ether 3c:ec:ef:d0:11:6e C bond0
ip-5-199-172-50.007.ptr ether 3c:ec:ef:d0:11:54 C bond0
ip-5-199-172-67.004.ptr ether 7c:c2:55:31:64:f0 C bond0
ip-5-199-172-17.004.ptr ether 3c:ec:ef:d0:11:32 C bond0
ip-5-199-172-8.005.ptr. ether 3c:ec:ef:d0:11:9e C bond0
ip-5-199-172-39.006.ptr ether 3c:ec:ef:d0:10:40 C bond0
10.100.0.53 (incomplete) bond0.2150
ip-5-199-172-61.008.ptr ether ae:2a:fa:a7:6d:3a C bond0
ip-5-199-172-59.006.ptr ether 7c:c2:55:31:64:7c C bond0
ip-5-199-172-28.005.ptr ether 3c:ec:ef:d0:4f:2a C bond0
ip-5-199-172-68.005.ptr ether 7a:09:21:e5:63:82 C bond0
ip-5-199-172-49.006.ptr ether 3c:ec:ef:d0:11:52 C bond0
ip-5-199-172-26.003.ptr ether 3c:ec:ef:d0:49:6f C bond0

...
To display the mapping of a single host, pass the -D switch followed by its IP address.
arp -D 5.199.172.5
Output5.199.172.5 (5.199.172.5) -- no entry
#nmcli command
The nmcli is a versatile CLI tool for displaying, modifying activating, and deleting network connections.
If nmcli is not available on your system, install the NetworkManager package:
sudo apt install network-manager -y
Without command flags, the nmcli provides a detailed summary of all network interfaces.
nmcli
This provides interface details, including the hardware model, Mac address, MTU, routes, and IP addresses.
Outputbond0: unmanaged
        "bond0"
        bond, 3C:EC:EF:D0:10:6C, sw, mtu 1500

eno1np0: unmanaged
        "Intel X710"
        ethernet (i40e), 3C:EC:EF:D0:10:6C, hw, sriov, port 3cecefd0106c, mtu 1500

eno2np1: unmanaged
        "Intel X710"
        ethernet (i40e), 3C:EC:EF:D0:10:6C, hw, sriov, port 3cecefd0106d, mtu 1500

lo: unmanaged
        "lo"
        loopback (unknown), 00:00:00:00:00:00, sw, mtu 65536

bond0.2150: unmanaged
        "bond0.2150"
        vlan, 3C:EC:EF:D0:10:6C, sw, mtu 1500

Use "nmcli device show" to get complete information about known devices and
"nmcli connection show" to get an overview on active connection profiles.

Consult nmcli(1) and nmcli-examples(7) manual pages for complete usage details.
You can display a specific interface connection using the nmcli device show command as shown.
nmcli device show eno1np0
OutputGENERAL.DEVICE: eno1np0
GENERAL.TYPE: ethernet
GENERAL.HWADDR: 3C:EC:EF:D0:10:6C
GENERAL.MTU: 1500
GENERAL.STATE: 10 (unmanaged)
GENERAL.CONNECTION: --
GENERAL.CON-PATH: --
WIRED-PROPERTIES.CARRIER: on
IP4.GATEWAY: --
IP6.GATEWAY: --
To show the status of all the connections, run:
nmcli connection show
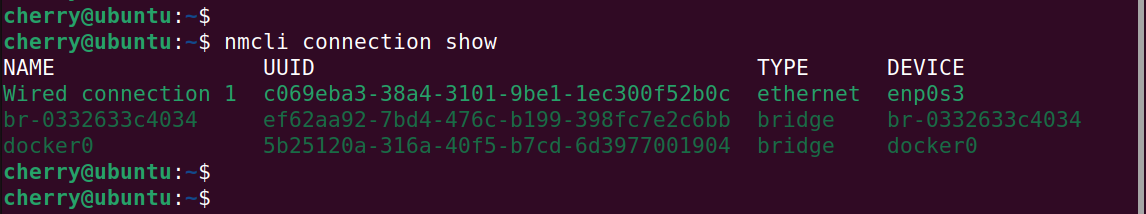
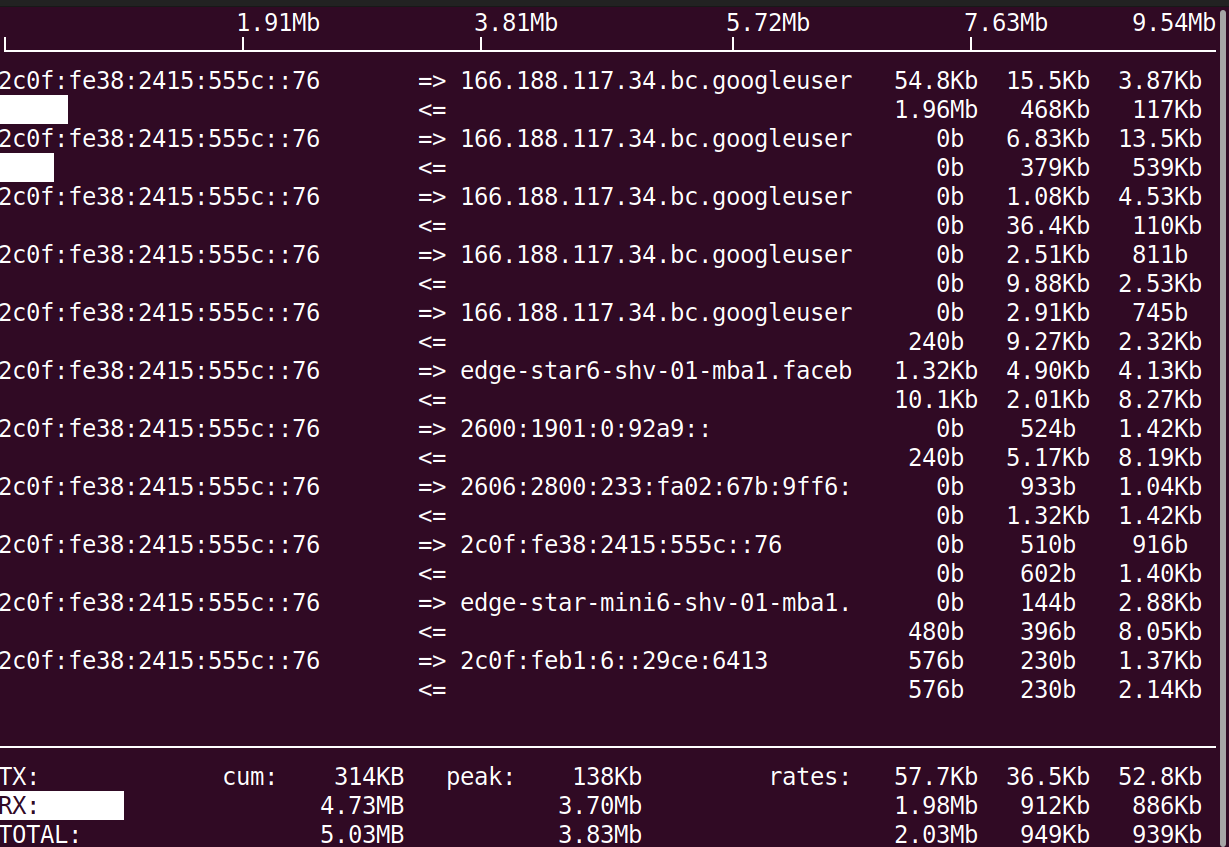
#iftop command
Short for Interface TOP, iftop is a command-line tool for monitoring bandwidth usage on a specific network interface. Run it as a sudo user or root to monitor all traffic flowing through the interface.
By default, iftop is not installed. You can install it by running:
#On Ubuntu / Debian systems
sudo apt install iftop -y
#On RHEL / Fedora
sudo dnf install iftop -y
Then run the command:
iftop
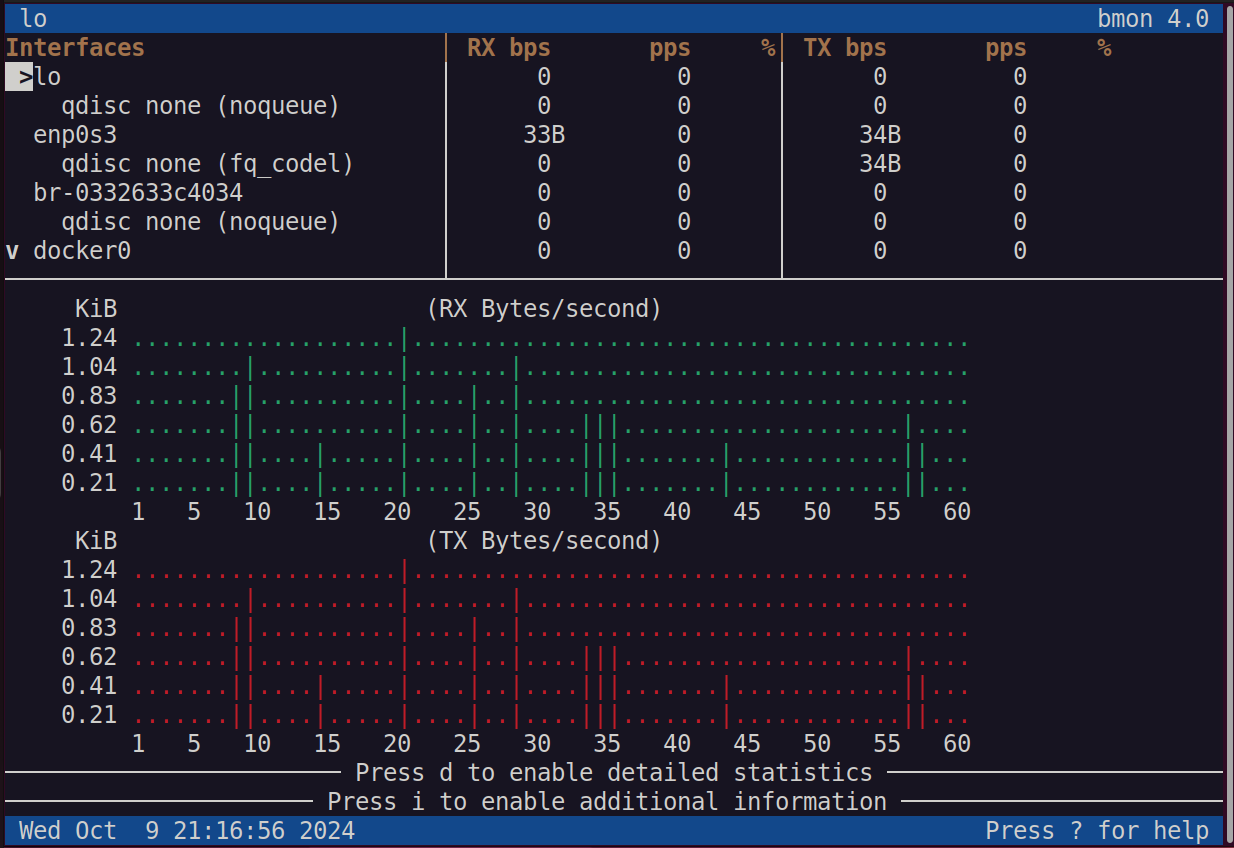
#bmon command
The bmon command is a revamped alternative to iftop. it displays bandwidth statistics in an intuitive and human-readable format.
Bmon is not installed out of the box, and you can do so by running:
#On Ubuntu / Debian systems
sudo apt install bmon -y
#On RHEL / Fedora
sudo dnf install bmon -y
To launch it and start monitoring bandwidth, simply run the command:
bmon
#Troubleshooting common networking issues
The commands above are most useful when combined into diagnostic workflows. Here are four common problems and the steps to isolate them.
#Server unreachable
Start with ping <host> to confirm whether the remote host responds at all. If packets time out, run traceroute <host> or mtr <host> to identify which hop drops the traffic. A failure at the first hop usually points to a local gateway or routing issue. Check your default route with ip route and verify the gateway is reachable with ping <gateway-ip>.
#DNS not resolving
If ping works with an IP address but fails with a domain name, the issue is DNS. Run dig <domain> to check whether your configured DNS server returns an answer. If the ANSWER SECTION is empty, try a different resolver: dig @8.8.8.8 <domain>. Verify your DNS configuration in /etc/resolv.conf or with resolvectl status on systems using systemd-resolved.
#Port not listening
When a service should be running but clients cannot connect, verify the port is open with ss -tlnp | grep <port>. If the port does not appear, the service is either not running or bound to a different address. Check the service status with systemctl status <service>. If the port shows as listening on 127.0.0.1, the service only accepts local connections. Update its configuration to bind to 0.0.0.0 or the server's public IP.
#Slow network performance
Use iftop to monitor real-time bandwidth consumption per connection and identify which hosts or processes are saturating the link. For a broader view across all interfaces, run bmon. If a single connection dominates the bandwidth, investigate the source process with ss -tp | grep <ip> to find the responsible application.
#Conclusion
You now have a practical reference for 20 Linux network commands that cover interface management, connectivity testing, DNS lookups, file transfers, port scanning, and bandwidth monitoring. Combining these tools into diagnostic workflows lets you pinpoint issues faster than relying on any single command.
For a deeper look at network configuration and firewall setup on Linux servers, check out our guide on Linux networking basics for server administration. You can also learn how to manage firewall rules with our iptables tutorial.
FAQs
What is the difference between ss and netstat?
`ss` is the modern replacement for `netstat` and reads socket data directly from kernel space, making it significantly faster on systems with many connections. Both display open ports, listening sockets, and connection states. On newer Linux distributions, `netstat` requires installing the `net-tools` package, while `ss` is available by default.
How do I find my public IP address from the command line?
Run `curl ifconfig.me` or `curl icanhazip.com`. These services return your external IP address as seen from the internet, which differs from the local IP shown by `ip addr` if you are behind a NAT gateway or router.
Which command should I use to test DNS resolution?
Use `dig` for detailed DNS output, including TTL values, authoritative nameservers, and record types. Use `nslookup` for quick lookups when you only need the resolved IP. Use `host` for a concise one-line answer. All three query DNS servers, but `dig` provides the most diagnostic detail.
How do I check which process is using a specific port?
Run `sudo ss -tlnp | grep <port>` to see which process listens on a given TCP port. The `-p` flag displays the process name and PID. You can also use `sudo lsof -i :<port>` for the same information with additional file descriptor details.
What is the difference between traceroute and mtr?
`traceroute` sends packets once and shows the path to a destination with latency per hop. `mtr` runs continuously, combining traceroute and ping into a live display that updates as conditions change. Use `traceroute` for a quick one-time check, and `mtr` when you need to watch for intermittent packet loss over time.
Can I use these commands on any Linux distribution?
Yes. All 20 commands in this guide work across Debian, Ubuntu, RHEL, Fedora, Arch, and other major distributions. Some tools, like `iftop`, `bmon`, `mtr`, and `nmap` may require installation from your distribution's package manager. Core utilities like `ip`, `ping`, `ss`, and `ssh` are included in base installations.