New Integrated Server Monitoring and Metrics Dashboard Now Available


We're happy to share a major upgrade to server monitoring across the Cherry Servers platform.
Customers can now access a new integrated metrics monitoring experience directly from the Cherry Servers portal, providing deeper visibility into server performance and resource utilization without relying on external dashboards.
The new system is available today and will gradually replace the legacy monitoring platform currently in use.
#Monitor Your Infrastructure Directly in the Portal
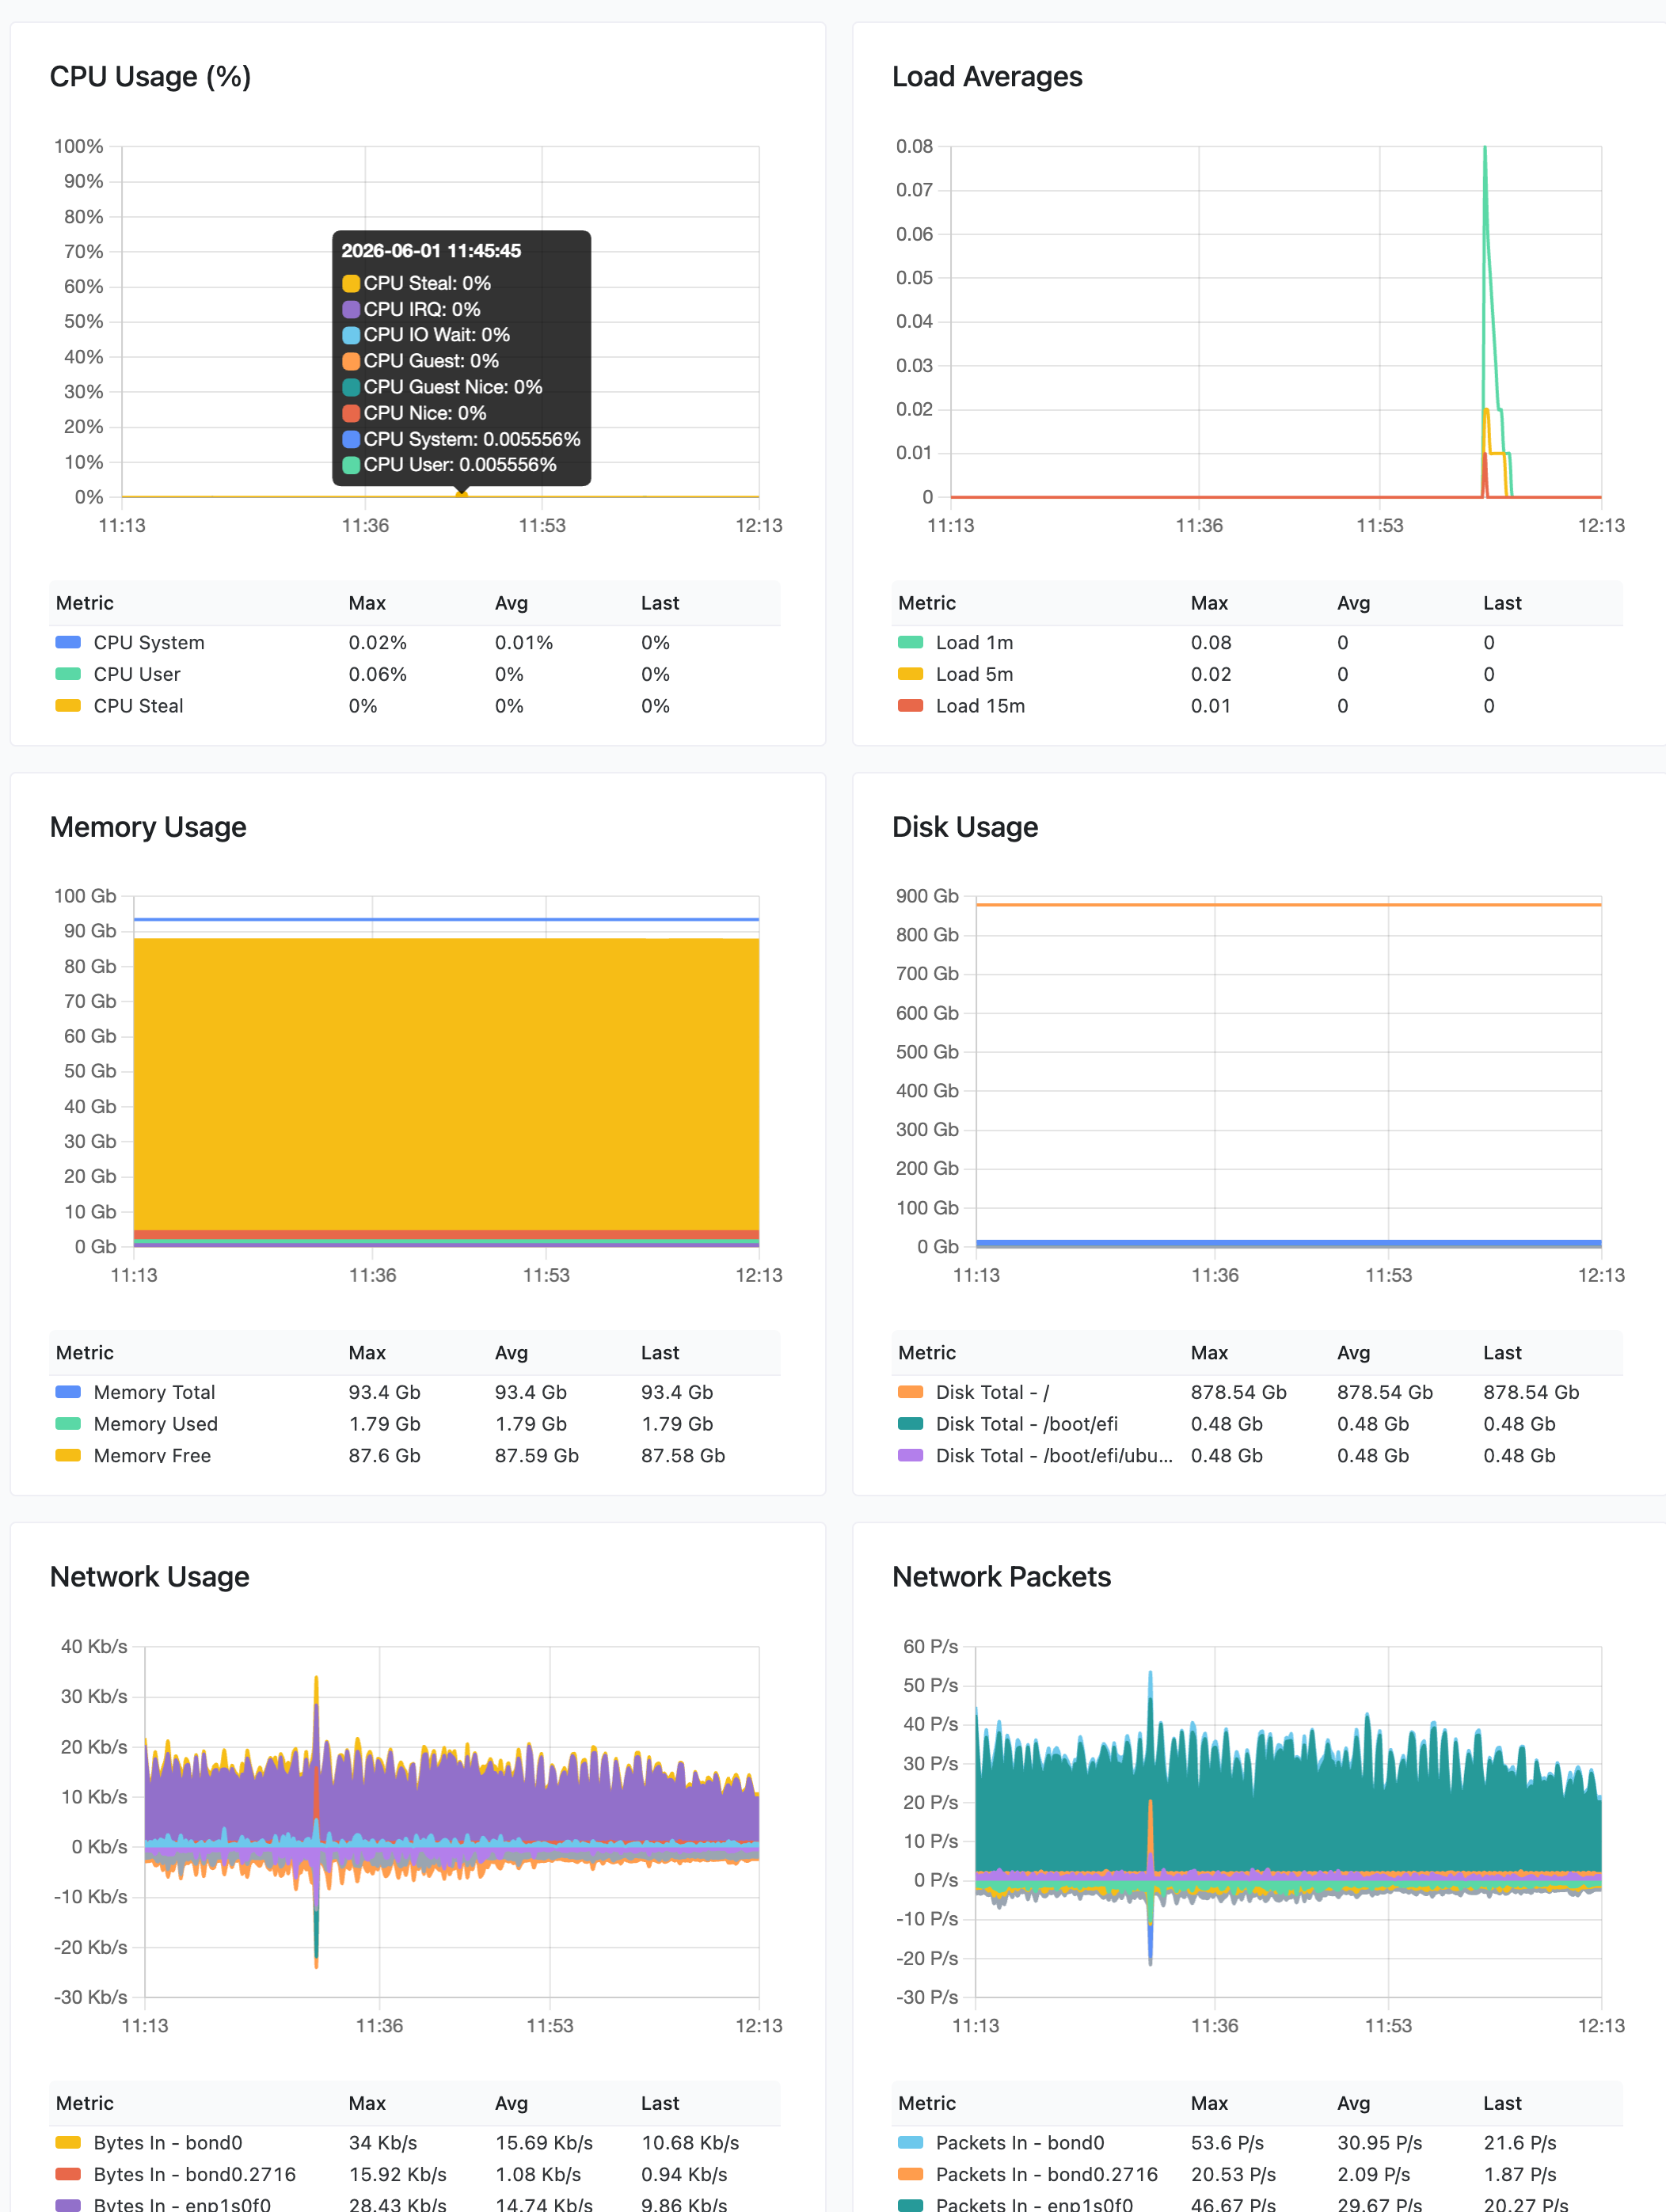
The new monitoring dashboard is fully integrated into the Cherry Servers portal, making it easier to track server performance without switching between multiple tools.
Customers can view detailed resource usage graphs for:
- CPU utilization
- Memory usage
- Network traffic
- Disk usage
- Disk I/O activity
Whether you're running production applications, databases, blockchain infrastructure, or development environments, the new dashboard provides a clearer picture of how your infrastructure is performing in real time.
#Flexible Monitoring Controls
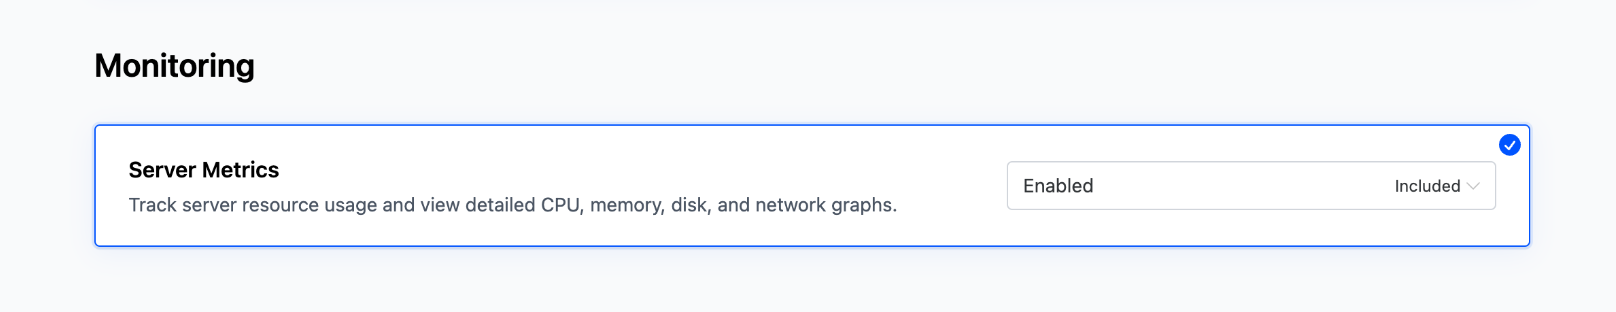
Customers now have greater control over monitoring configuration.
Server monitoring is enabled by default for new deployments but can be disabled at any time directly through the Cherry Servers portal:
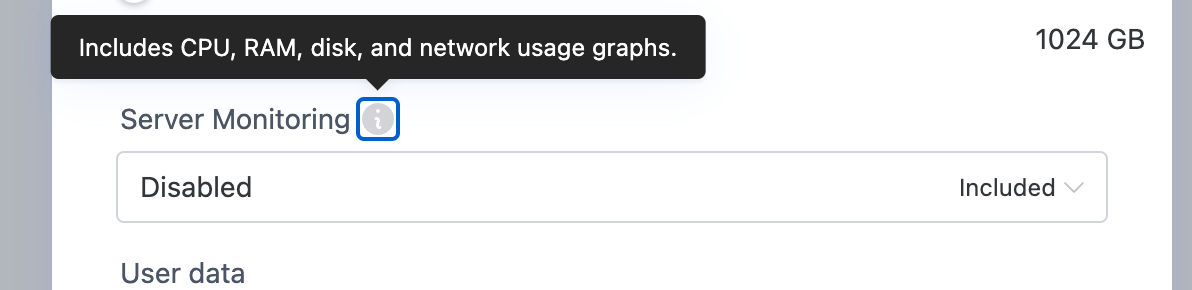
The same option applies during server redeployment:
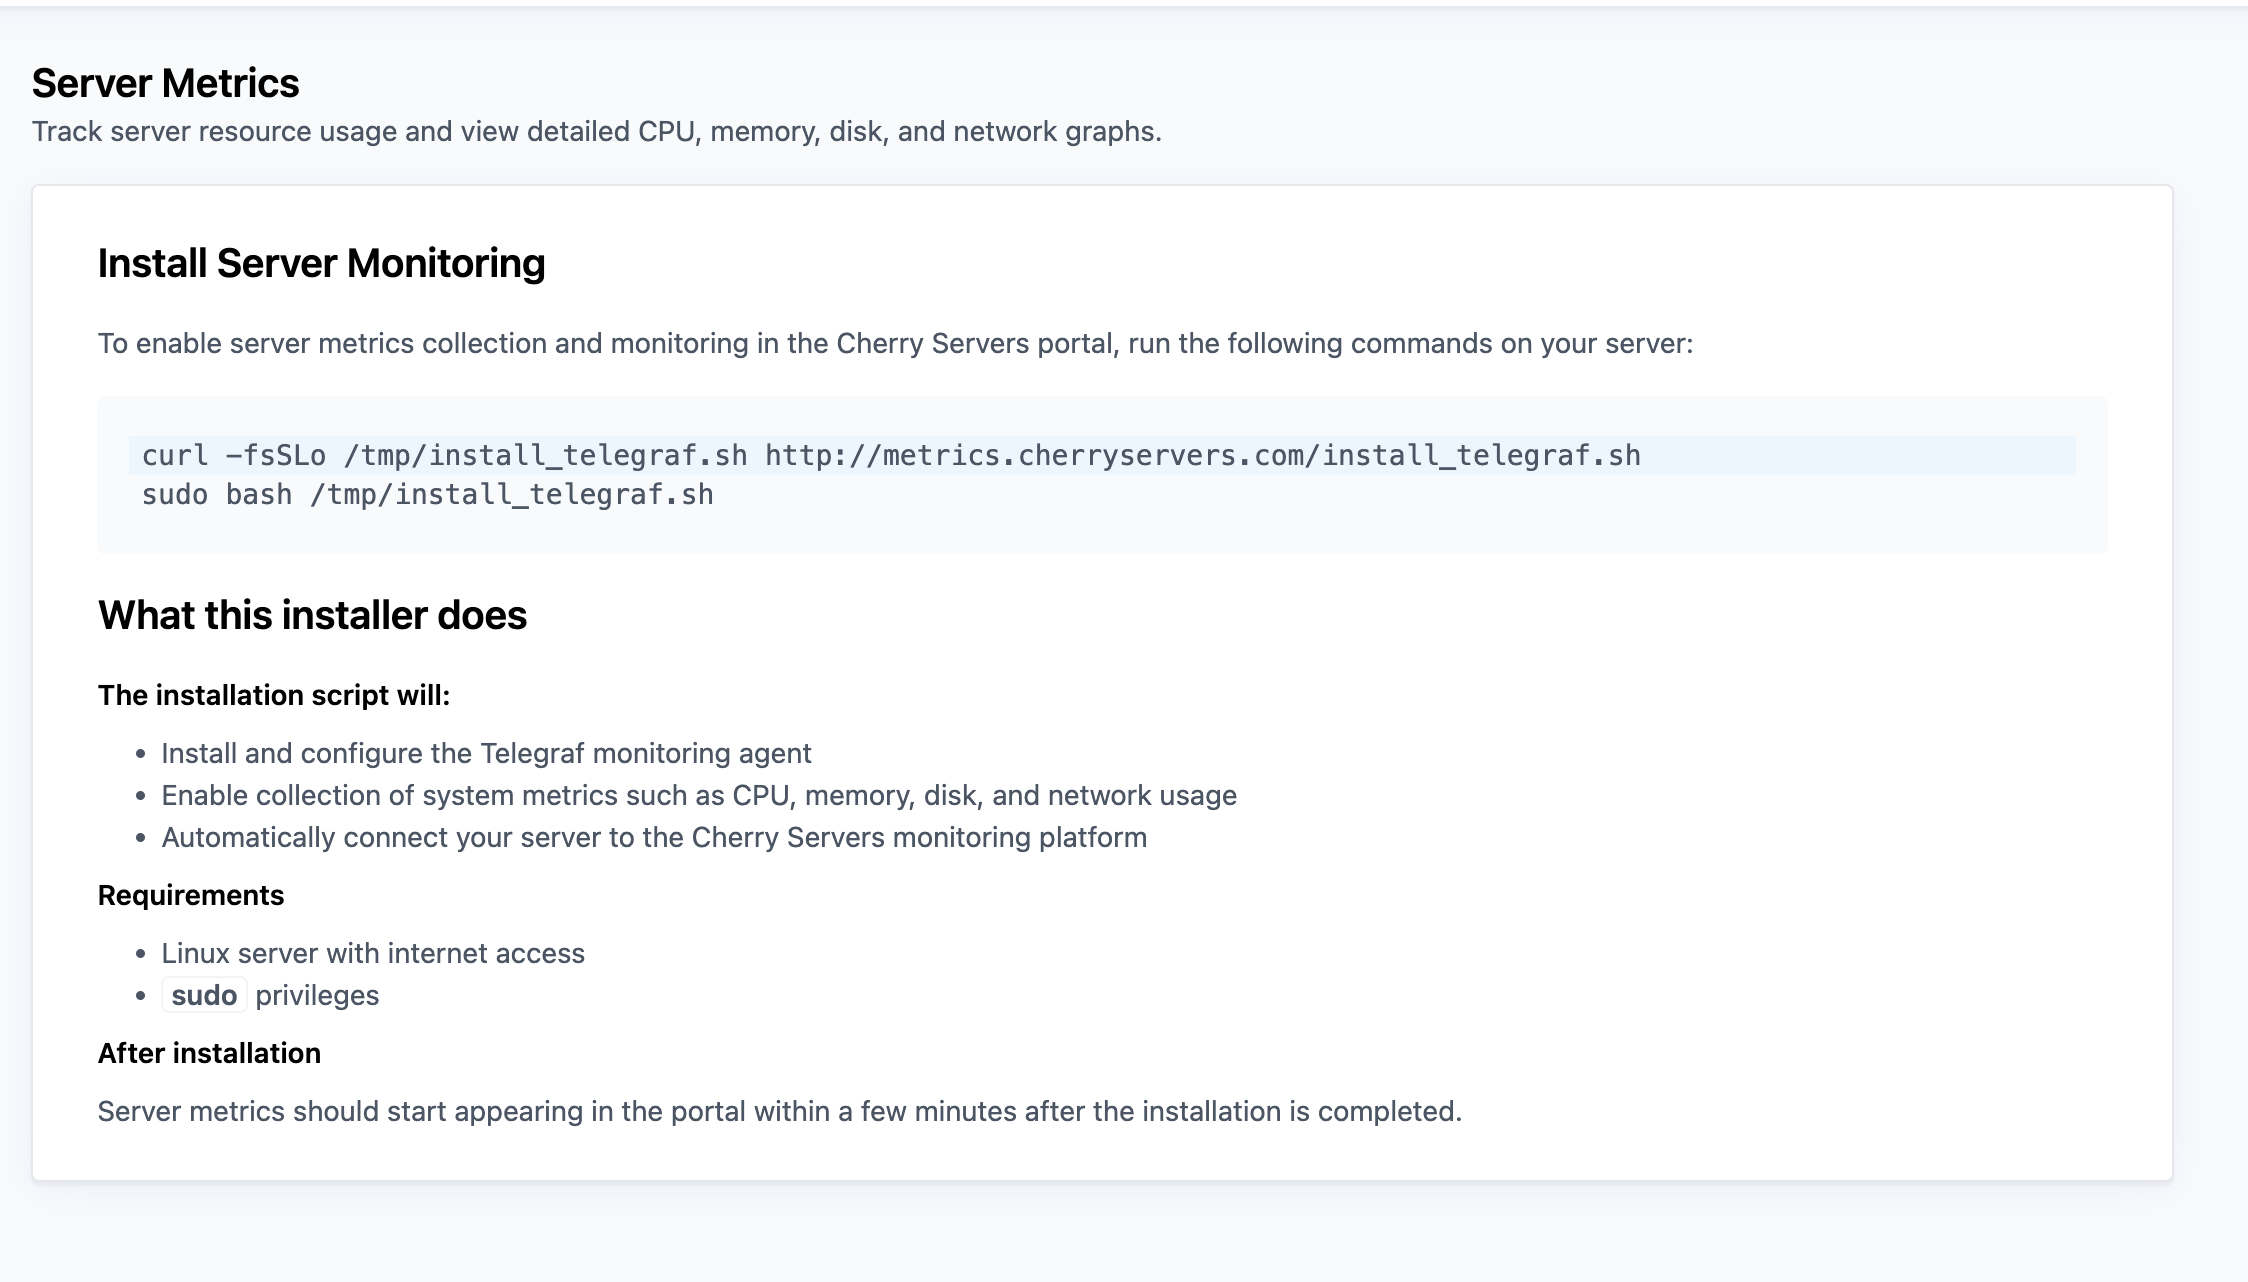
If the metrics system is not enabled on the client server that is already installed, the metrics page will provide detailed instructions on how to enable server resource monitoring:
#Multiple Time Ranges and Historical Views
After following the instructions, the resource schedules on the portal should start appearing within a few minutes. The new dashboard supports multiple levels of graph granularity, allowing customers to analyze both short-term activity and long-term trends.
Available views include:
- 1 hour
- 24 hours
- 7 days
- 30 days
- and 1 year.
This makes it easier to investigate incidents, analyze resource consumption, and plan future infrastructure capacity.
#Legacy Monitoring Deprecation
Note: The existing legacy monitoring platform will remain available until August 1, 2026, after which it will be permanently retired.
Customers currently using the legacy monitoring system can continue accessing their existing graphs during the transition period and will see instructions within the portal explaining how to activate the new monitoring experience.
#What’s Next
This upgrade is part of our ongoing effort to improve infrastructure visibility, simplify operations, and provide customers with better tools for managing performance-sensitive workloads.
We're excited to continue expanding the platform and delivering additional monitoring and observability improvements in the future.
— Cherry Servers Product Team
