How to Install Prometheus on Ubuntu 24.04


Prometheus is an essential tool in modern application deployment and DevOps environments. It provides observability into the health, performance, and reliability of applications, and is key in monitoring microservice applications in Kubernetes ecosystems.
Prometheus integrates seamlessly with tools like Helm, Jenkins, and Grafana for improved visualization of key metrics. It’s a household name in developer circles due to its CI/CD integration, huge online community, and its ability to cut across cloud and on-premise environments.
#What is Prometheus?
Prometheus is an open-source metrics-based monitoring and alerting tool hosted by Cloud Native Computing Foundation (CNCF) under the Apache License 2.0. It’s an essential component in monitoring the health and performance of cloud-native and distributed environments.
Prometheus monitors nodes, applications, and application-level metrics, including request rates, latency, and error rates. It utilizes specialized agents called Node exporters to retrieve metrics, such as memory, disk I/O, CPU, and network statistics, from physical or virtual machines, including Linux servers.
It provides comprehensive monitoring capabilities for Docker containers and Kubernetes clusters, encompassing monitoring of pods, nodes, services, and the overall cluster health. Using other exporters, it can monitor API endpoints and databases.
#Key Features of Prometheus
At a glance, Prometheus is made of the following salient features:
#Simple Web Interface
Prometheus comes with a simple and neat Web UI for querying & graphing metrics from target nodes. It offers an HTTP API for querying metric data, retrieving information, setting and managing alerts. In addition, the API offers integration with tools like Grafana to create custom dashboards.
#PromQL
This is Prometheus's greatest flex. This is a powerful query language that enables users to perform a wide range of operations, including searching and filtering data, comparing metrics, and performing aggregate functions such as SUM, AVG, and MAX on time-series data.
#Pull-based metrics collection system
Instead of a push-based system, Prometheus employs a pull-based metrics system for better control, reliability, and debugging. It actively 'pulls' metrics from applications via the HTTP endpoint and collects them. This approach makes Prometheus an excellent choice for DevOps ecosystems, especially Kubernetes.
#Exporters
Prometheus offers exporters, which are agents that collect and ship metrics from target nodes, including operating systems and APIs. Once collected, metrics are formatted into a Prometheus metric format. Node_Exporter is a widely used exporter used to retrieve information from UNIX/Linux systems such as Linux, FreeBSD, and OpenBSD. Additionally, Prometheus provides exporters for databases such as PostgreSQL and MySQL.
#Alert manager
As the name suggests, the component lets you create and manage alerts from the Prometheus server and channel them to the intended destination, including email, Slack, and other platforms.
#Installing Prometheus on Ubuntu 24.04
In this guide, we will walk you through how to install Prometheus on Ubuntu 24.04. At the tail end of his guide, we will demonstrate how you can query metrics using PromQL.
#Prerequisites
Before proceeding, ensure you have the following list of requirements:
-
A newly deployed instance of Ubuntu 24.04 VPS
-
A sudo user configured on the instance for running elevated privileges
#Step 1: Update the system
Access your VPS or server instance as a sudo user and update the local package index.
sudo apt update
Once updated, head over to the next step
#Step 2: Create Prometheus user and group
Once installed, Prometheus will run as a systemd service. Best practice recommends creating a dedicated non-privileged user and group for Prometheus. This enforces the least privilege principle, limiting the scope of compromise in the event of a security breach. Not running Prometheus as root significantly reduces the attack surface.
First, let’s create a dedicated group called prometheus.
sudo groupadd --system prometheus
Next, we will create a dedicated, non-login system user also called prometheus and add it to the prometheus group.
sudo useradd -s /sbin/nologin --system -g prometheus prometheus
#Step 3: Create directories for Prometheus data and configuration files
Prometheus requires custom directories into which it will store its configuration file and user data files. We are going to create each of these.
Starting with the directory for storing the configuration file, run the command:
sudo mkdir /etc/prometheus
Next, create the data storage directory into which all Prometheus data will be stored.
sudo mkdir /var/lib/prometheus
#Step 4: Download Prometheus
Once all Prometheus directories are in place, it's time to download the Prometheus installation file. For demonstration, we will be downloading Prometheus 2.55.1.
Use the wget command to download the tarball file as shown.
wget https://github.com/prometheus/prometheus/releases/download/v2.55.1/prometheus-2.55.1.linux-amd64.tar.gz
The downloaded tarball file is roughly 107 MB. Once downloaded, extract it.
tar xvf prometheus-2.55.1.linux-*
#Step 5: Configure Prometheus
The Prometheus installation folder is now in place. You need to take the next steps to set it up and ensure Prometheus is ready to scrape data.
Copy binaries and configure required permissions
Moving on, you need to move the prometheus and promtool binaries from the Prometheus folder to the /usr/local/bin directory. To accomplish this, run:
sudo mv prometheus-2.55.1.linux-amd64/prometheus /usr/local/bin/
sudo mv prometheus-2.55.1.linux-amd64/promtool /usr/local/bin/
Next, set the permissions of the binaries to the Prometheus user and group.
sudo chown -R  prometheus:prometheus /usr/local/bin/prometheus
sudo chown -R  prometheus:prometheus /usr/local/bin/promtool
Transfer configuration libraries and configure ownership
Next, you need to move the libraries in the consoles and console_libraries sub-folders to the /etc/prometheus directory.
sudo mv prometheus-2.55.1.linux-amd64/consoles /etc/prometheus
sudo mv prometheus-2.55.1.linux-amd64/console_libraries /etc/prometheus
Do the same to the prometheus.yml configuration file.
sudo mv prometheus-2.55.1.linux-amd64/prometheus.yml /etc/prometheus
Next, set the permissions to the Prometheus user and group.
sudo chown -R prometheus:prometheus /etc/prometheus
sudo chown -R prometheus:prometheus /var/lib/prometheus
Create a systemd configuration file
Prometheus is going to run as a systemd file, and therefore, it’s essential to create a systemd file for that. To do so, use your preferred editor and run the following command. Here, we are using the nano editor.
sudo nano /etc/systemd/system/prometheus.service
Paste the following lines of code.
[Unit]
Description=Prometheus
Wants=network-online.target
After=network-online.target

[Service]
User=prometheus
Group=prometheus
Type=simple
Restart=on-failure
RestartSec=5s
ExecStart=/usr/local/bin/prometheus \
    --config.file /etc/prometheus/prometheus.yml \
    --storage.tsdb.path /var/lib/prometheus/ \
    --web.console.templates=/etc/prometheus/consoles \
    --web.console.libraries=/etc/prometheus/console_libraries \
    --web.listen-address=0.0.0.0:9090 \
    --web.enable-lifecycle \
    --log.level=info

[Install]
WantedBy=multi-user.target
Save the changes and exit the text editor.
Once the service file is in place, reload systemd to notify the system of the newly added file.
sudo systemctl daemon-reload
Now start Prometheus
sudo systemctl start prometheus
Consider also enabling Prometheus to start on boot
sudo systemctl enable prometheus
Additionally, ensure that the Prometheus service is active and running
sudo systemctl status prometheus
The following output confirms Prometheus is running as expected.
Output● prometheus.service - Prometheus
     Loaded: loaded (/etc/systemd/system/prometheus.service; enabled; preset: enabled)
     Active: active (running) since Wed 2026-01-14 10:49:30 UTC; 3h 59min ago
   Main PID: 7976 (prometheus)
      Tasks: 8 (limit: 4602)
     Memory: 50.9M (peak: 61.9M)
        CPU: 17.357s
     CGroup: /system.slice/prometheus.service
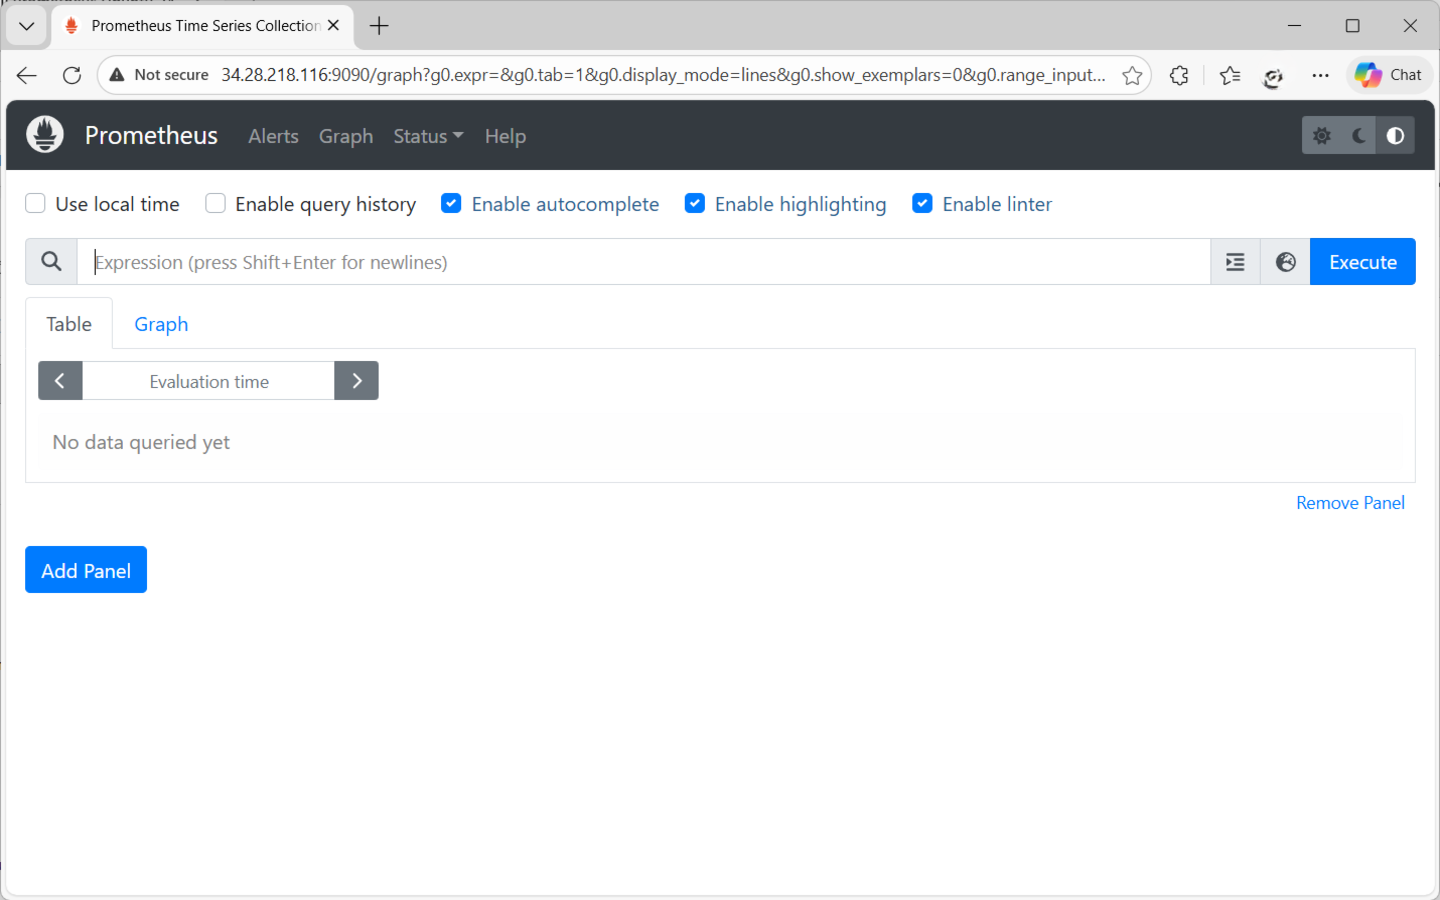
#Step 6: Access Prometheus from a browser
With all the configurations and settings in place, it’s now time to access Prometheus
And start scraping metrics from target systems. To access the Prometheus web interface, visit the URL http://server-ip:9090 in your browser. This is what you should see once the page has loaded.
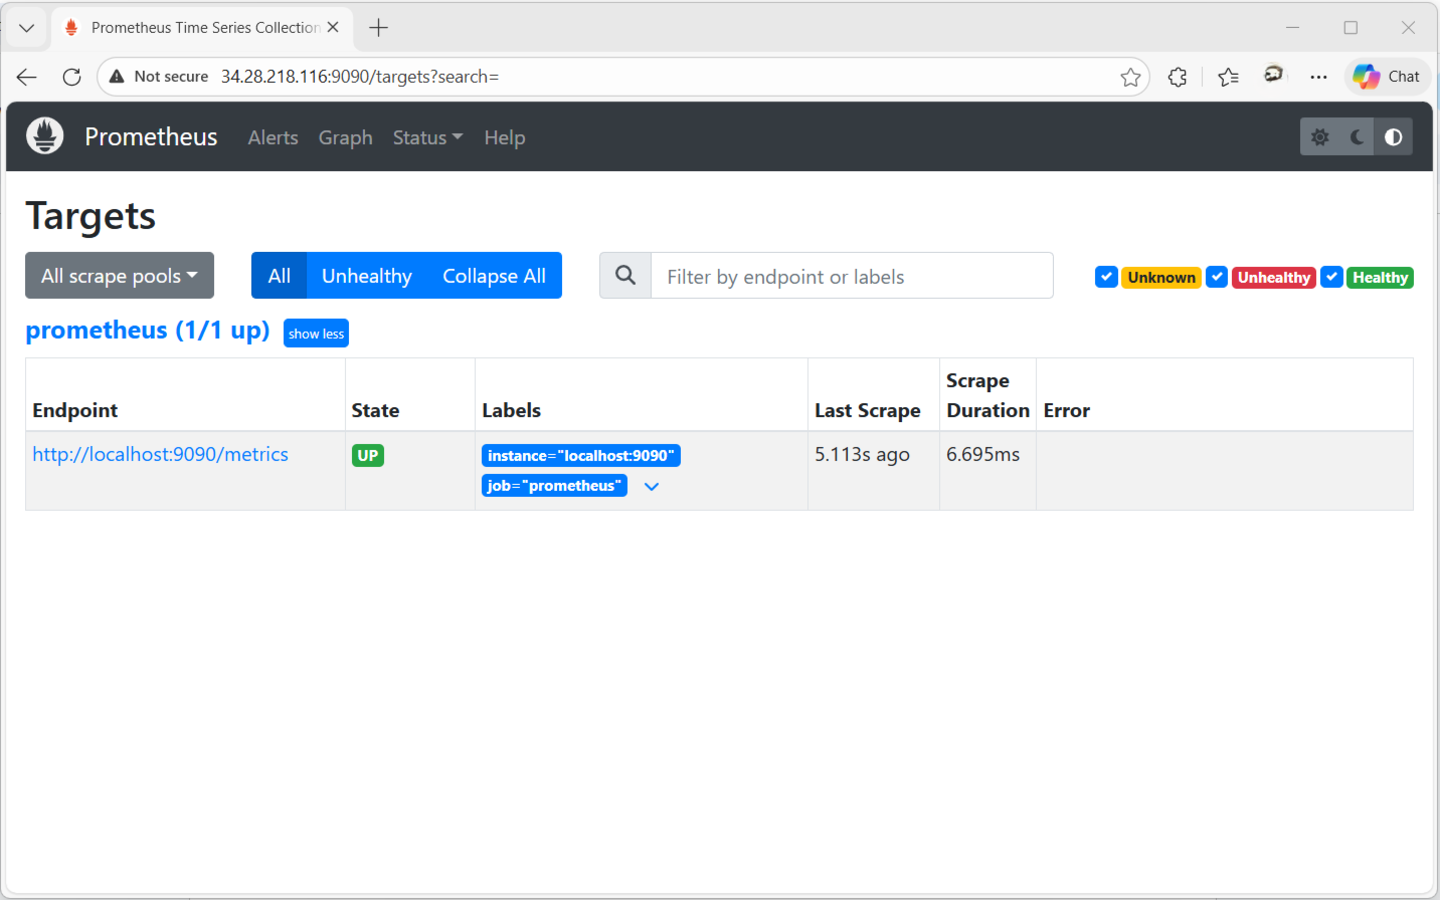
To check configured endpoints, head to Status > Targets. This section displays all targets and their current status. Currently, only one endpoint is configured as shown.
#Step 7: Install Node Exporter
For standard OS systems, such as Ubuntu, Fedora, and Debian, Prometheus utilizes node_exporter, a lightweight agent that exposes and collects a wide array of kernel and hardware metrics, including memory, CPU, and disk I/O statistics. The agent runs as a standalone system service on the target system to be monitored. It packages the metrics in a format that can be scraped via an HTTP endpoint.
To install Node_exporter, visit the Prometheus download page. Currently, the latest version is v1.10.2
wget https://github.com/prometheus/node_exporter/releases/download/v1.10.2/node_exporter-1.10.2.linux-amd64.tar.gz
Next, extract the tarball file.
tar -xvf node_exporter-*
Once extracted, move the node_exporter executable to the /usr/local/bin directory.
sudo mv node_exporter-1.10.2.linux-amd64/node_exporter /usr/local/bin/
You can confirm the version of Node exporter by running:
node_exporter --version
Outputnode_exporter, version 1.10.2 (branch: HEAD, revision: 654f19dee6a0c41de78a8d6d870e8c742cdb43b9)
  build user:       root@b29b4019149a
  build date:       20251025-20:05:32
  go version:       go1.25.3
  platform:         linux/amd64
  tags:             unknown
#Step 8: Set up Node Exporter to work with Prometheus
Once Node_exporter is installed, the next step is to create a systemd service file. But first, create a dedicated non-login system user to minimize chances of a breach.
sudo useradd -rs /bin/false node_exporter
Next, create a systemd service file.
sudo tee /etc/systemd/system/node_exporter.service > /dev/null <<EOF
[Unit]
Description=Node Exporter
Wants=network-online.target
After=network-online.target

[Service]
User=node_exporter
ExecStart=/usr/local/bin/node_exporter

[Install]
WantedBy=default.target
EOF
Reload systemd to recognize the new service.
sudo systemctl daemon-reload
Then enable it to start on boot, and start Node Exporter.
sudo systemctl enable node_exporter
sudo systemctl start node_exporter
It’s crucial to verify that the Node_exporter service is running, and to do so, run the command:
sudo systemctl status node_exporter
Output● node_exporter.service - Node Exporter
     Loaded: loaded (/etc/systemd/system/node_exporter.service; enabled; preset: enabled)
     Active: active (running) since Wed 2026-01-14 10:34:21 UTC; 4h 16min ago
   Main PID: 7376 (node_exporter)
      Tasks: 4 (limit: 4602)
     Memory: 8.4M (peak: 9.3M)
        CPU: 17.721s
     CGroup: /system.slice/node_exporter.service
             └─7376 /usr/local/bin/node_exporter
One last thing you need to do is add Node exporter as a target to the Prometheus configuration file. So once again, access the prometheus.yml file using your preferred editor.
sudo nano /etc/prometheus/prometheus.yml
Under the scrape_configs section, only one job is specified, which is the default prometheus job. Add the node-exporter job as shown.
    - job_name: "node_exporter"
    static_configs:
        - targets: ["localhost:9100"]
Save and exit, then restart Prometheus to effect the changes.
sudo systemctl restart prometheus
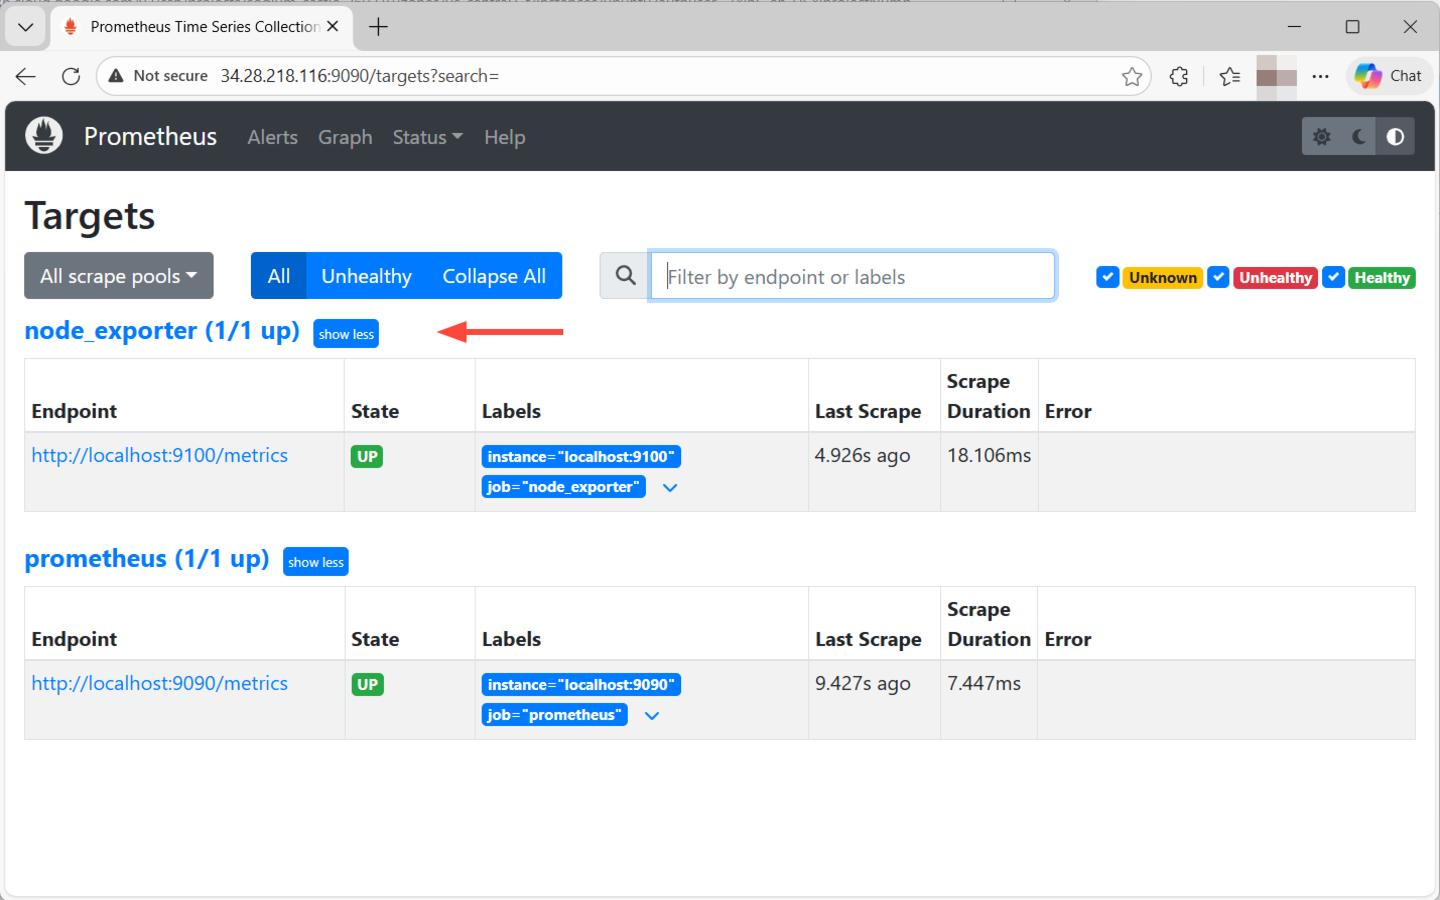
Now head back and refresh your browser. This time around, you will notice an additional endpoint at localhost:9100 labelled node_exporter. Click show more to reveal more information about the endpoint.
#Step 9: Query metrics in Prometheus
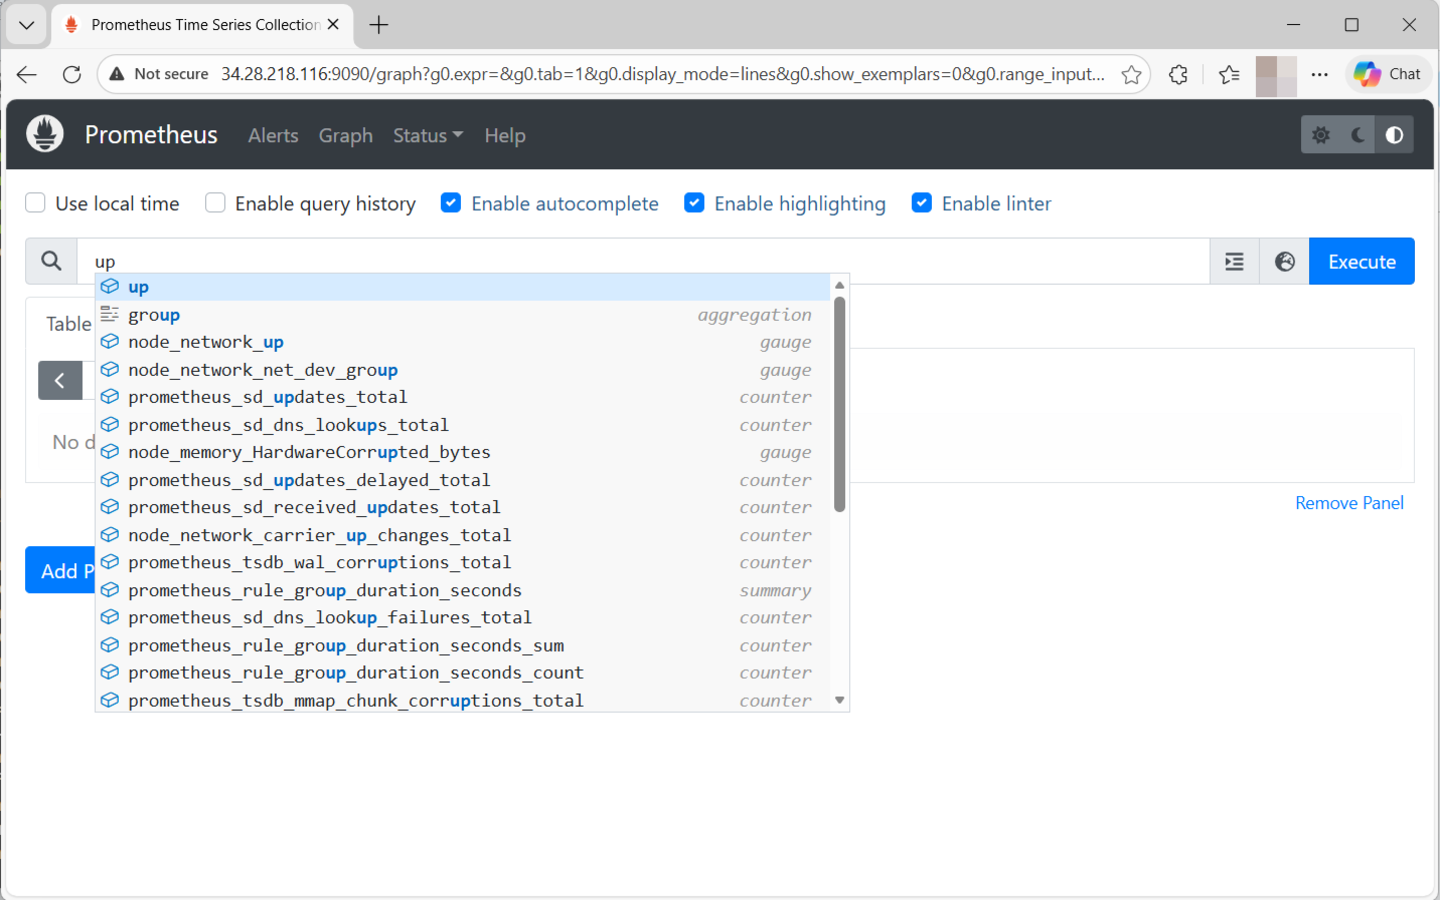
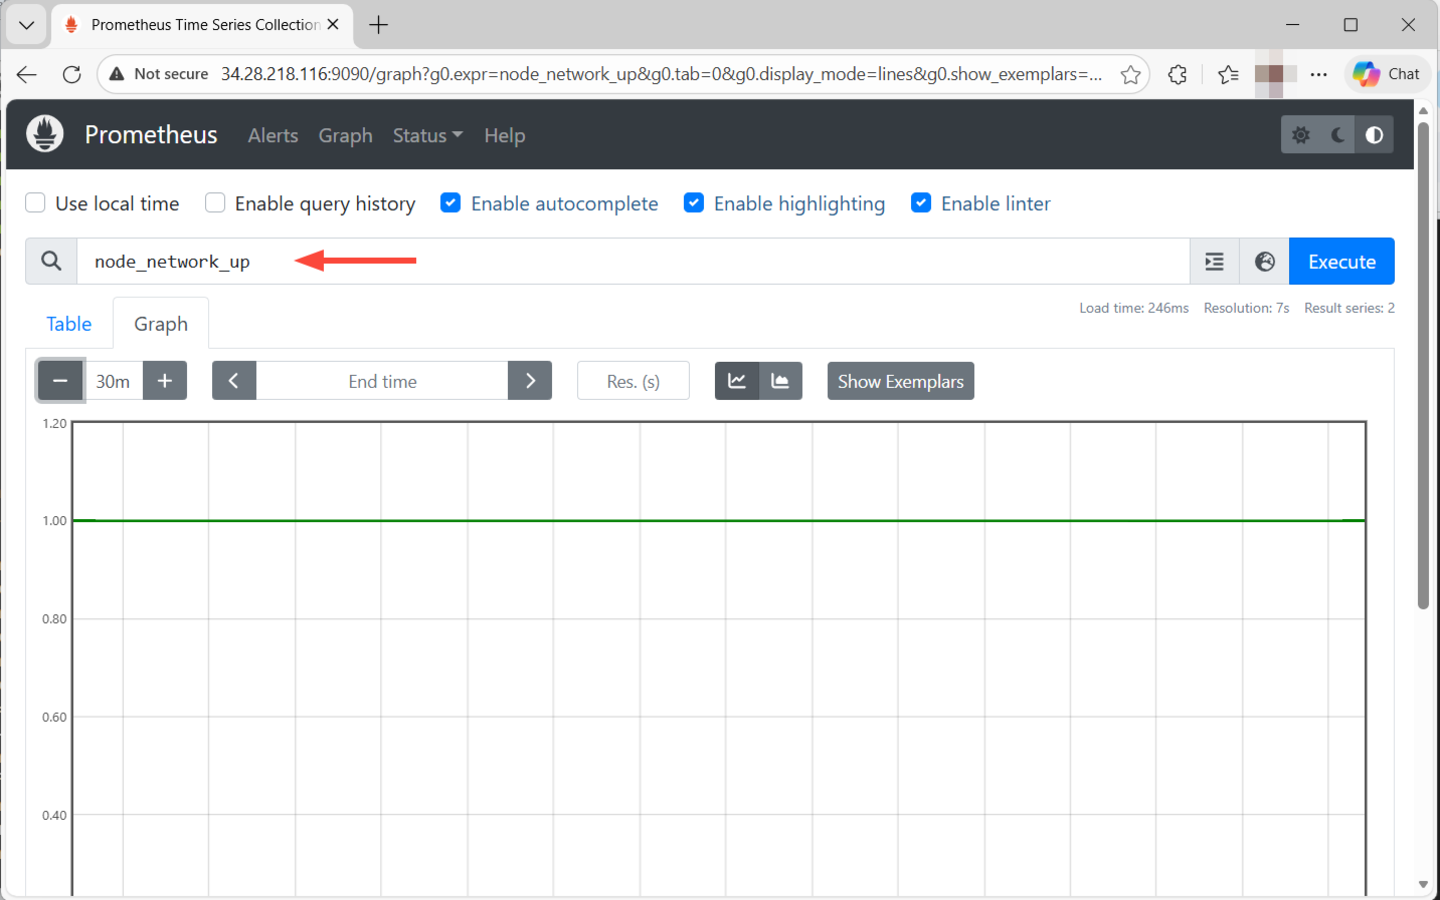
To query metrics, head back to the home page, and at the top, you will notice an expression input box that accepts prompts in PromQL. The easiest way to query metrics is to type in a metric name simply. Prometheus will auto-suggest the metric names to choose from.
For example, if you search up, you will get a drop-down list of possible metric names.
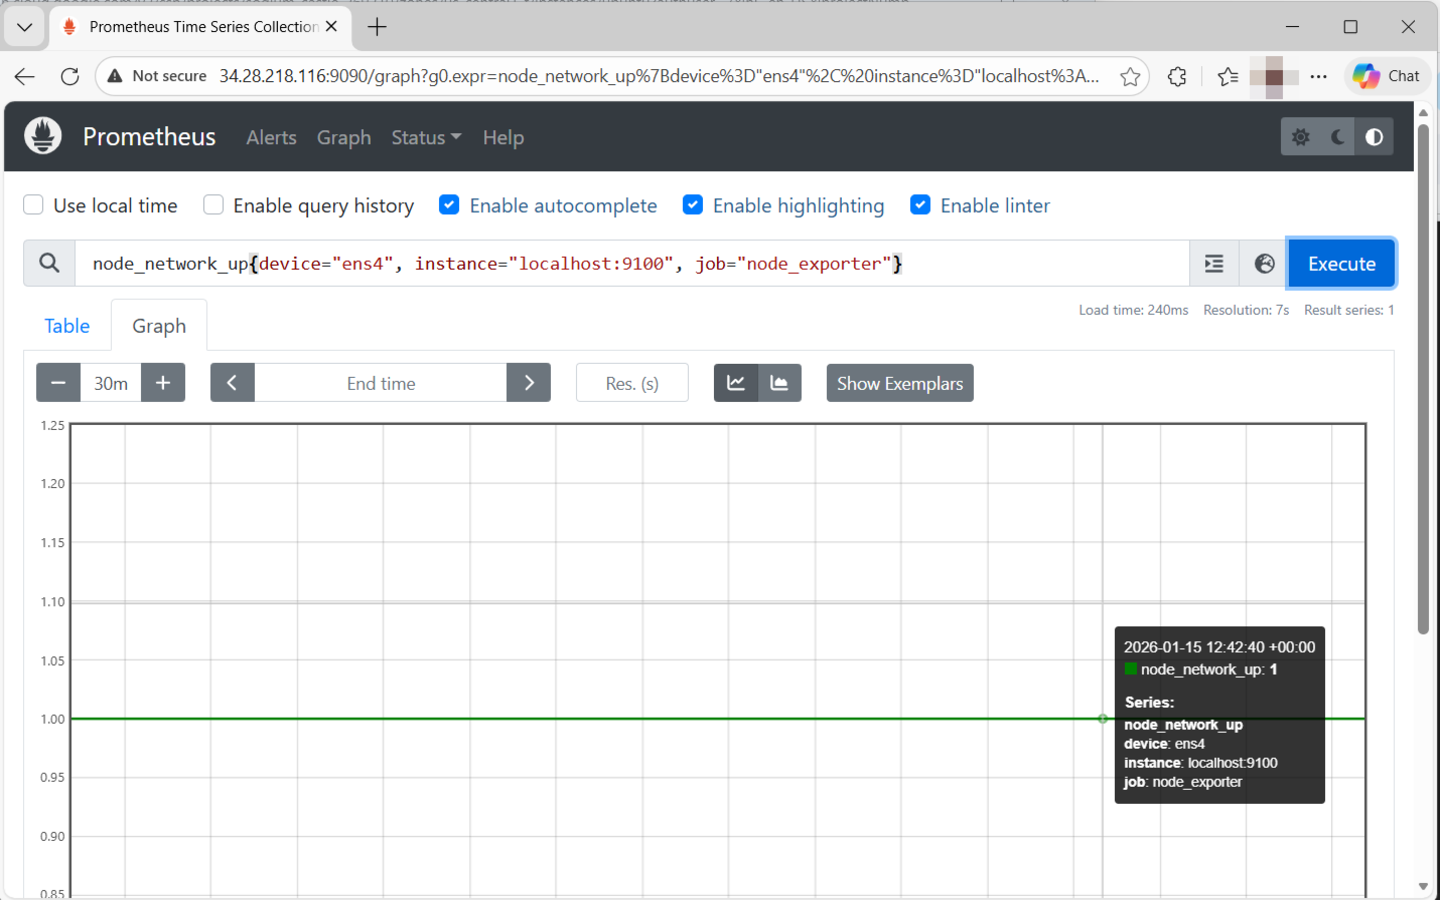
In our case, we will select node_network_up, which provides uptime metrics of the node. Next, click Execute and select the Graph button. This displays uptime time series data for the node. The value 1 indicates the node is healthy, while 0 means the node is down.
When you click the Table button, you’ll see the query you selected in PromQL. Here you can see the PromQL queries for both network interfaces: ens4 and the loopback address lo.
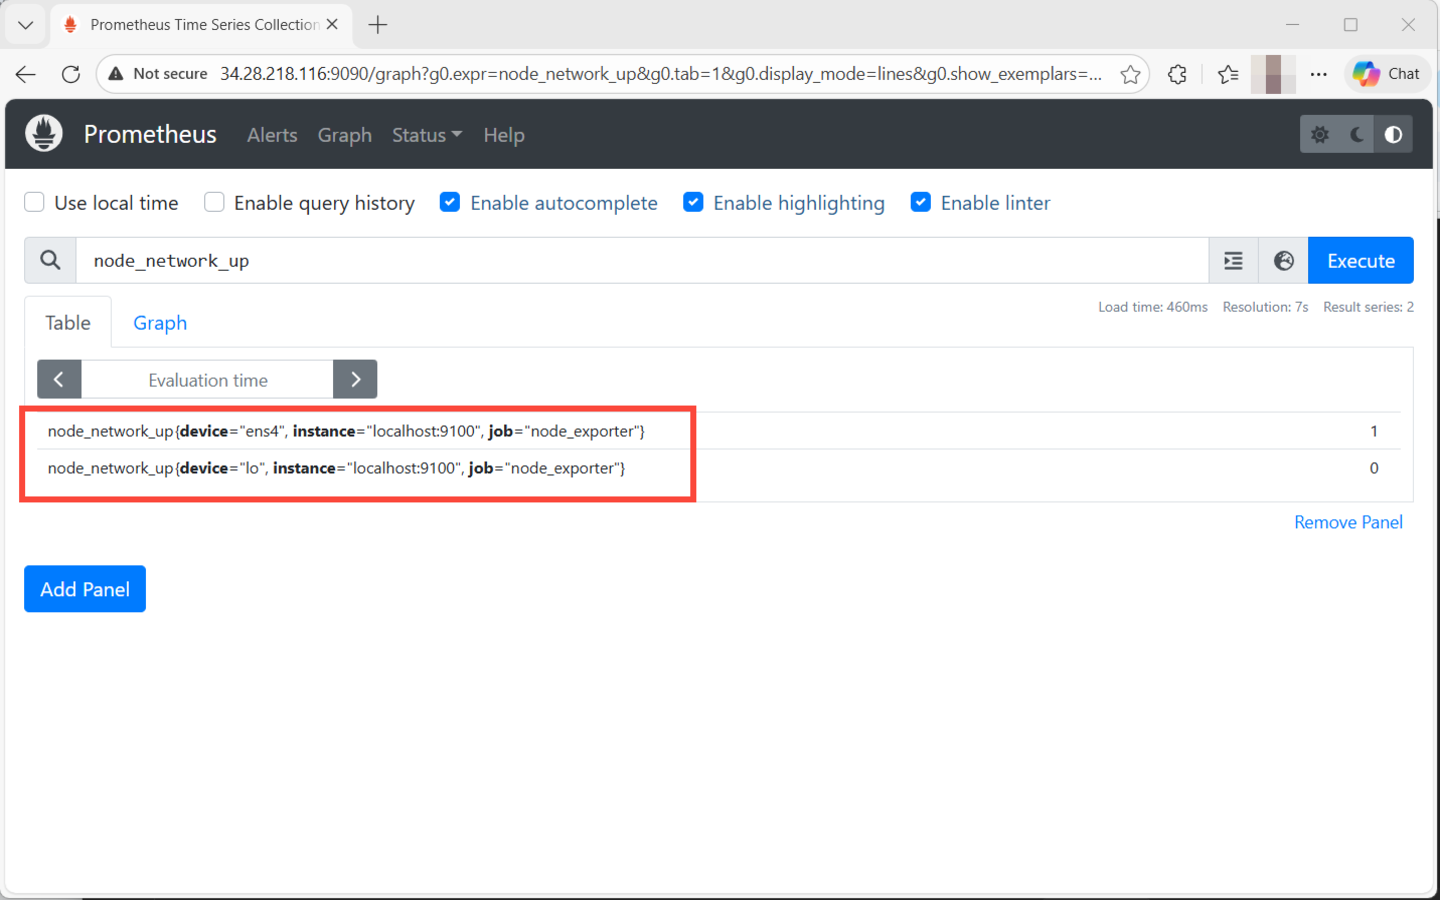
You can copy and run the query in the execution box to arrive at the same visualization.
To check the free memory available on your node, use the following query.
node_memory_MemFree_bytes{instance="localhost:9100", job="node_exporter"}
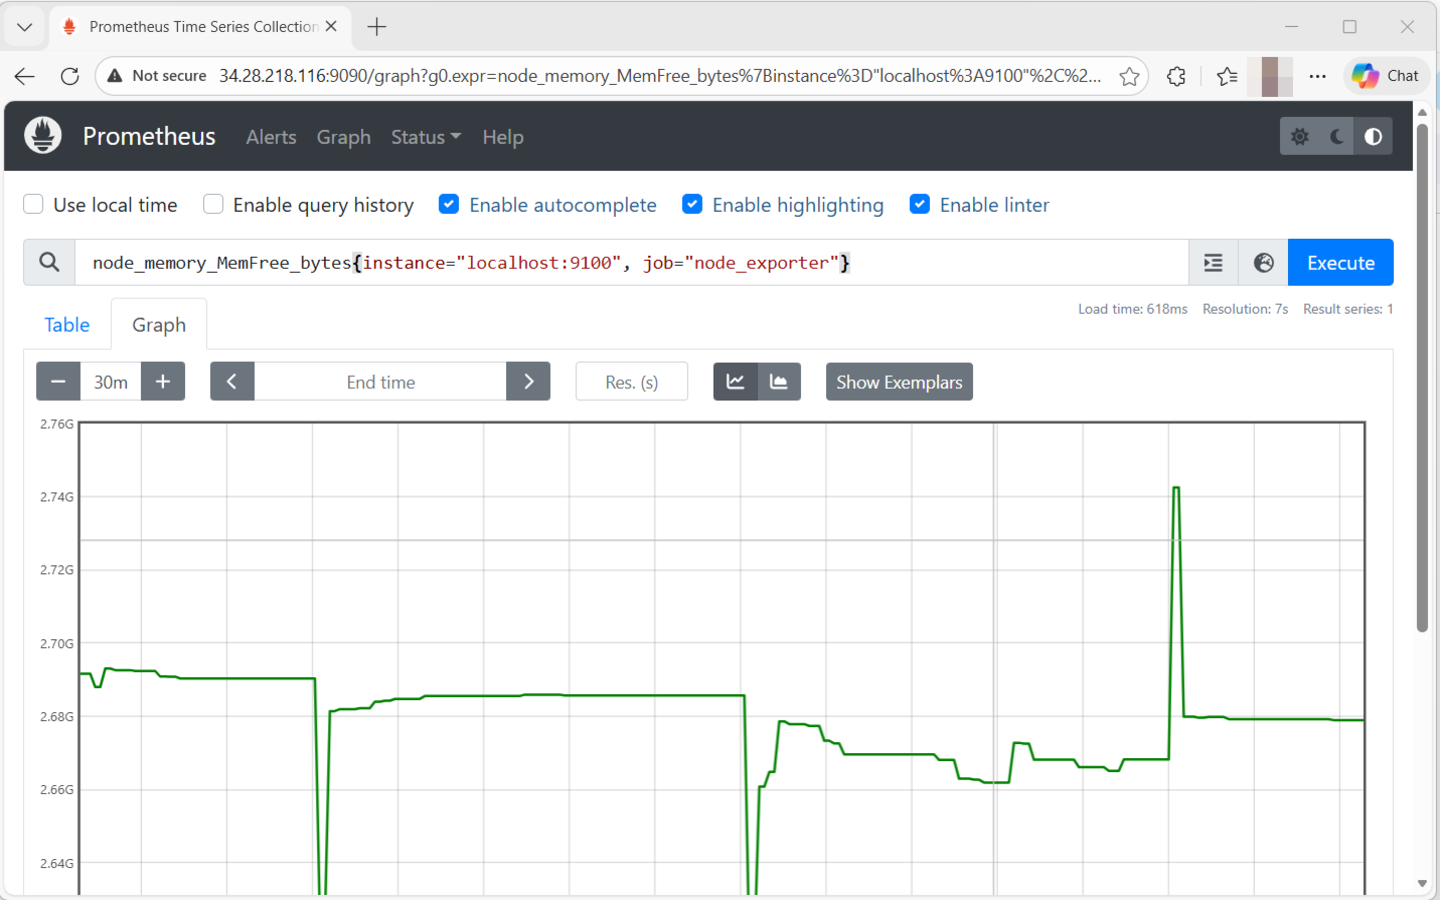
Those are just a few examples. There are so many metrics you can query from the Prometheus interface. Even better, you can configure Prometheus to work with Grafana for enhanced and more intuitive graphing and visualization of metrics. Check our detailed guide on how to set up Prometheus and Grafana.
#Conclusion
Prometheus remains a key pillar in cloud-native and DevOps environments, providing insights into the health and performance of applications and nodes. In this guide, we have walked you through the step-by-step installation of Prometheus on Ubuntu 24.04. Additionally, we have demonstrated the process of querying the metrics on the UI to have a glance at the performance of certain system parameters.