Every Linux-based bare metal server comes with a pre-installed Sensu monitoring agent that tracks the server’s CPU, memory, network, and disk activity. You may check these metrics in real-time in your client portal by clicking on the server you would like to monitor, and selecting "Graphs" in the left section.
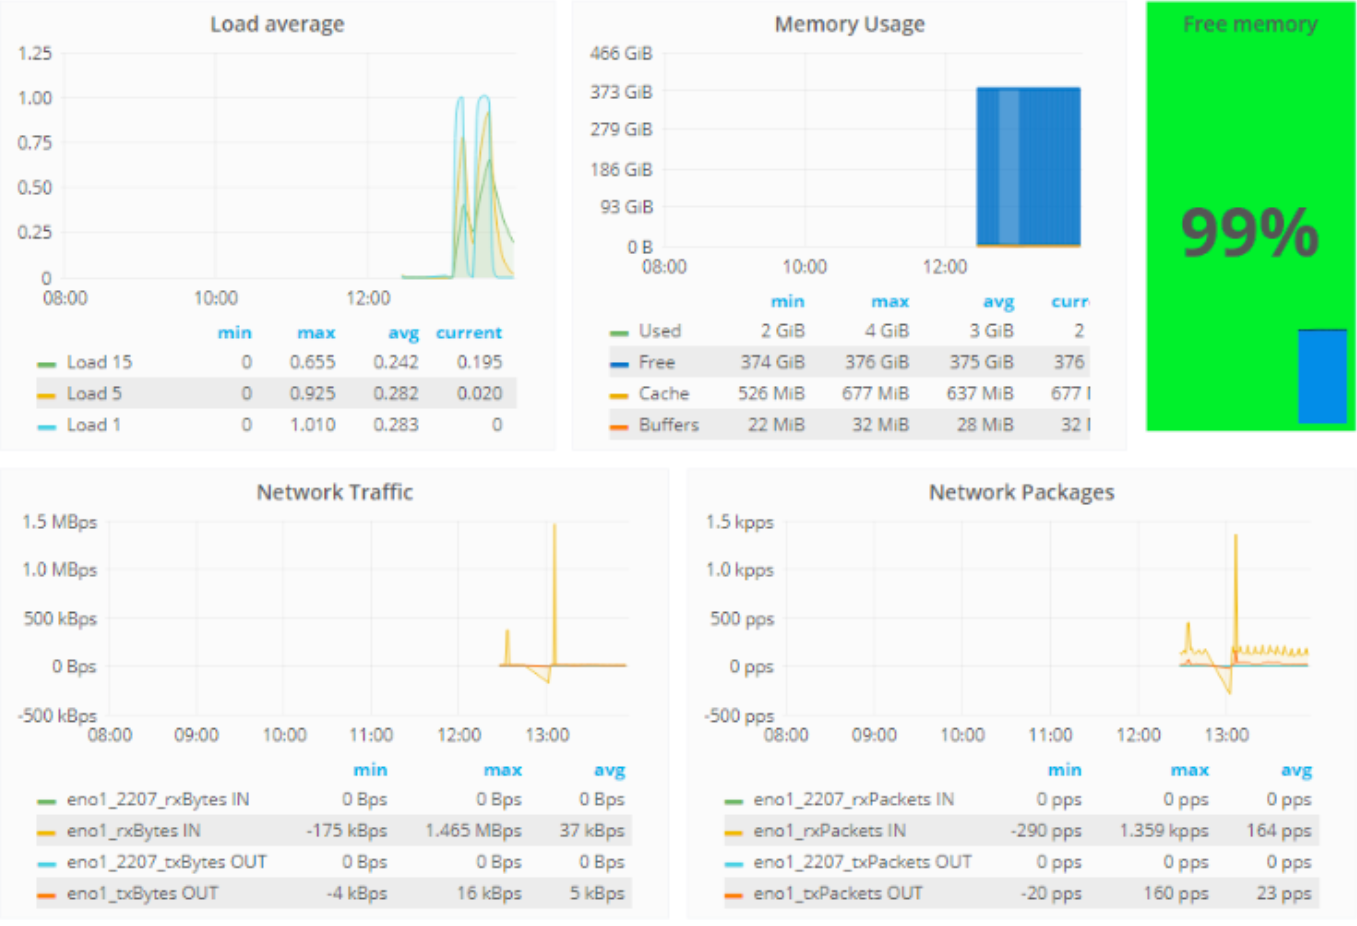
For data visualization, we use Grafana to provide clear, informative graphs, as shown in the image below:
Was this article helpful?
Thanks for the feedback!